
Açıklama
Genel Bakış
Piyasa yönünü tahmin etmeyi bırakın. EMA MTF Bulutu & Gösterge Paneli, scalperlar ve günlük traderlar için tasarlanmış kapsamlı bir trend takip aracıdır. Üssel Hareketli Ortalamaların akıcılığını Çoklu Zaman Dilimi analizinin gücü ile birleştirir, hepsi temiz bir grafik arayüzünde.
Standart göstergelerin aksine, bu araç Akıllı Nötr Bölge mantığı içerir, dalgalı piyasaları filtreleyerek yatay dönemlerdeki yanlış sinyallerden sizi korur.
Ana Özellikler
✅ Dinamik EMA Bulutları
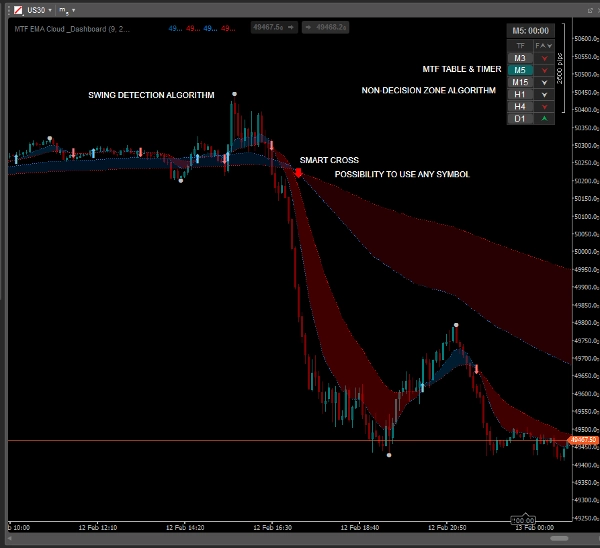
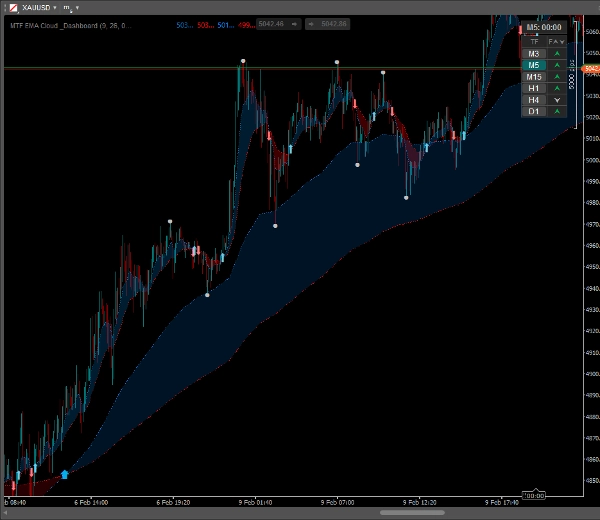
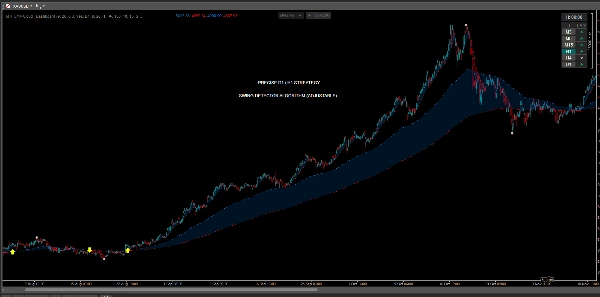
Trend anında görselleştirilir. Hızlı ve Yavaş EMA'lar arasındaki alan yarı saydam bir bulutla doldurulur, bu da trend gücünü ve potansiyel destek/direnç bölgelerini kolayca tanımlamanızı sağlar.
✅ MTF Üst Üste Biniş (Çoklu Zaman Dilimi)
Grafikleri değiştirmeden "Büyük Resmi" görün. Daha yüksek zaman dilimi EMA'larını (örneğin, H1) doğrudan daha düşük zaman dilimi grafiğinizde (örneğin, M5) gösterin.
- MTF trendi için ayrı kesişim okları içerir!
✅ Akıllı Trend Gösterge Paneli
6 zaman dilimi (M3'ten Günlük'e) için trend durumunu gösteren kompakt, tıklanabilir bir tablo.
- Nötr Bölge Mantığı: Gösterge paneli yatay piyasaları (konsolidasyon) algılar ve bunları gri/gümüş renkte işaretler, kötü işlemlerden uzak durmanıza yardımcı olur.
- Etkileşimli: Tablo içindeki herhangi bir Zaman Dilimi düğmesine tıklayarak grafiği anında değiştirebilirsiniz.
✅ Swing Yüksek / Swing Düşük Noktaları
Önemli yerel tepeleri ve dipleri otomatik olarak işaretler. Stop Loss emirleri yerleştirmek veya yakın fiyat yapısına göre Take Profit seviyelerini belirlemek için mükemmeldir.
✅ Görsel Kesişim Sinyalleri
EMA Hızlı, EMA Yavaş ile kesiştiğinde net, özelleştirilebilir oklar görünür.
- Renkleri, boyutları ve ok stillerini özelleştirin.
✅ Mum Zamanlayıcı
Yerleşik geri sayım sayacı, mum kapanana kadar ne kadar zaman kaldığını tam olarak gösterir, giriş zamanlamanız için önemlidir.
Nasıl İşlem Yapılır (Strateji Örneği)
- Gösterge Panelini Kontrol Edin: Daha yüksek zaman dilimlerinin (örneğin, H1, H4) uyumlu (Yeşil/Kırmızı) olduğundan emin olun. "Nötr" (Gri) gösteriyorlarsa işlem yapmaktan kaçının.
- Sinyali Bekleyin: Ana trend yönünde bir kesişim oku arayın.
- Fiyat Hareketi ile Onaylayın: Piyasa yapısını onaylamak için "Swing Yüksek/Düşük" noktalarını kullanın.
- Girin ve Yönetin: Mum kapanışında giriş yapın. Stop loss'unuzu takip etmek için EMA Bulutunu dinamik destek olarak kullanın.
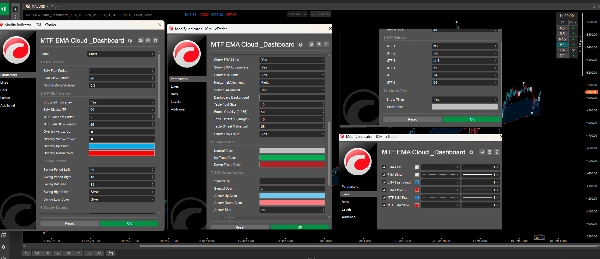
Özelleştirme
Gösterge, tarzınıza uyacak şekilde yüksek derecede özelleştirilebilir:
- Hem mevcut hem de MTF modları için EMA periyotlarını ayarlayın.
- Bulutlar, Oklar, Swingler ve Gösterge Paneli için renkleri değiştirin.
- Gösterge Paneli konumunu ve şeffaflığını yapılandırın.
- Herhangi bir özelliği bağımsız olarak Açık/Kapalı yapın.
Özet
A smart dashboard displays trend status across six timeframes (from 3 minutes to daily), incorporating a neutral zone logic that highlights flat or consolidating markets to help avoid false signals. The dashboard is interactive, enabling quick chart switching by clicking on timeframe buttons. The tool automatically marks swing high and low points to assist in setting stop loss and take profit levels based on recent price structure. Visual crossover arrows signal EMA fast and slow line crossovers, with customizable colors and styles. Additionally, a candle timer shows the remaining time until the current candle closes, aiding precise trade timing.
The indicator is highly customizable, allowing adjustments to EMA periods, colors, dashboard position, transparency, and feature toggling to fit individual trading styles. It supports markets including Forex, Crypto, and commodities like gold (XAUUSD), and is tagged for use with symbols such as BTCUSD and USDJPY.
Müşteri değerlendirmeleri
5 | 0 % | |
4 | 100 % | |
3 | 0 % | |
2 | 0 % | |
1 | 0 % |


