present
Inscrivez-vous et bénéficiez d'une remise de 50 $ sur votre premier achat
Trading product for TP_SL Indicateur Key Levels, image 1
TP_SL
Indicateur
127 téléchargements
Version 1.1, Jun 2026
Windows, Mac
Trading product for TP_SL Indicateur Key Levels, image 2
Trading product for TP_SL Indicateur Key Levels, image 3
Trading product for TP_SL Indicateur Key Levels, image 4
Trading product for TP_SL Indicateur Key Levels, image 5
32
Ventes
980
Installations gratuites

Description

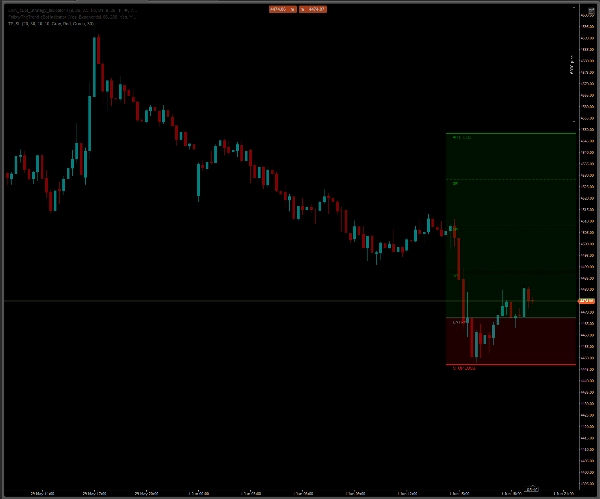
TP_SL Outil Risque & Récompense très utile (style TradingView)


Apportez l'outil ultime de position Long/Short au style TradingView directement sur vos graphiques cTrader !

Si vous avez déjà manqué un outil de dessin rapide, intuitif et interactif pour planifier vos trades, calculer le risque et projeter visuellement les niveaux de Take Profit, cet indicateur est fait pour vous. Conçu pour la rapidité et une esthétique de graphique épurée, il vous permet de tracer vos configurations de trading en moins d'une seconde.

🔥 Fonctionnalités clés :

  • Expérience TradingView dans cTrader : Reproduit l'outil visuel populaire de position Long/Short.
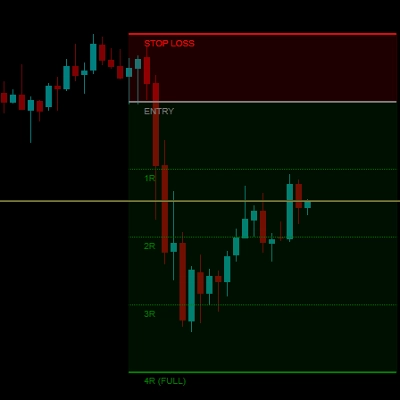
  • Basculement automatique intelligent (Long/Short) : Passe sans effort entre les positions Long et Short. Il suffit de faire glisser la ligne Stop Loss au-dessus de votre ligne d'Entrée, et les zones de Take Profit s'inverseront instantanément vers le bas.
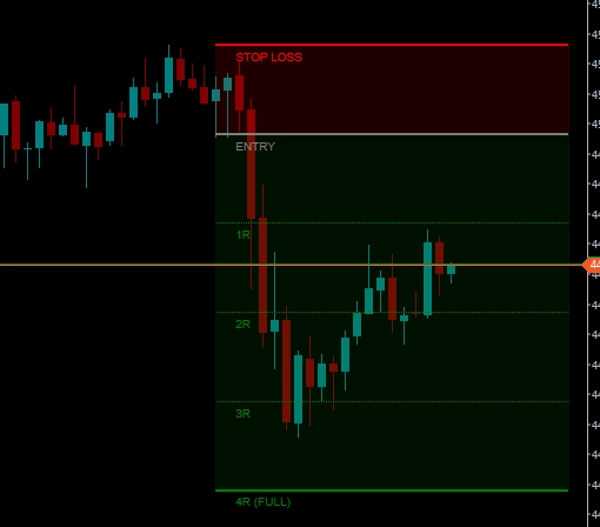
  • Multiples de risque automatiques (R-Math) : Calcule automatiquement votre risque (1R) basé sur la distance entre l'Entrée et le Stop Loss, et projette dynamiquement des niveaux précis de Take Profit pour 1R (sans risque), 2R, 3R et 4R (TP complet).
  • Technologie de graphique épurée : Contrairement aux lignes horizontales standard qui s'étendent à l'infini vers la gauche et encombrent vos données historiques, cet outil utilise des lignes limitées. Il crée un bloc net et autonome qui reste exactement là où vous en avez besoin.
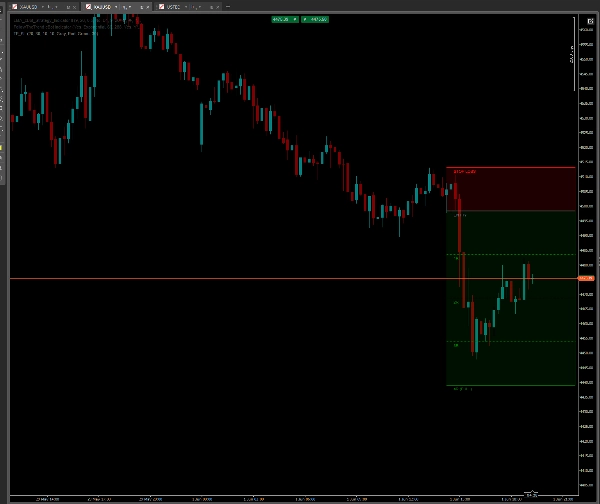
  • Suivi dynamique du prix : À mesure que de nouvelles bougies apparaissent, l'outil "flotte" automatiquement vers la droite, restant proche de l'action de prix actuelle.

⚡ Comment l'utiliser :

  1. Dessiner : Maintenez la touche SHIFT enfoncée et cliquez gauche n'importe où sur le graphique. La configuration apparaîtra instantanément.
  2. Ajuster : Il suffit de glisser-déposer la ligne grise "ENTRY" ou la ligne rouge "STOP LOSS" aux niveaux de prix souhaités. Toute la grille se calcule et s'ajuste en temps réel.
  3. Supprimer : Cliquez sur la ligne d'Entrée ou de Stop Loss et appuyez sur la touche Suppr de votre clavier. L'indicateur dispose d'une fonction de nettoyage automatique qui supprimera instantanément tout le dessin, sans laisser de désordre.

⚙️ Paramètres entièrement personnalisables :

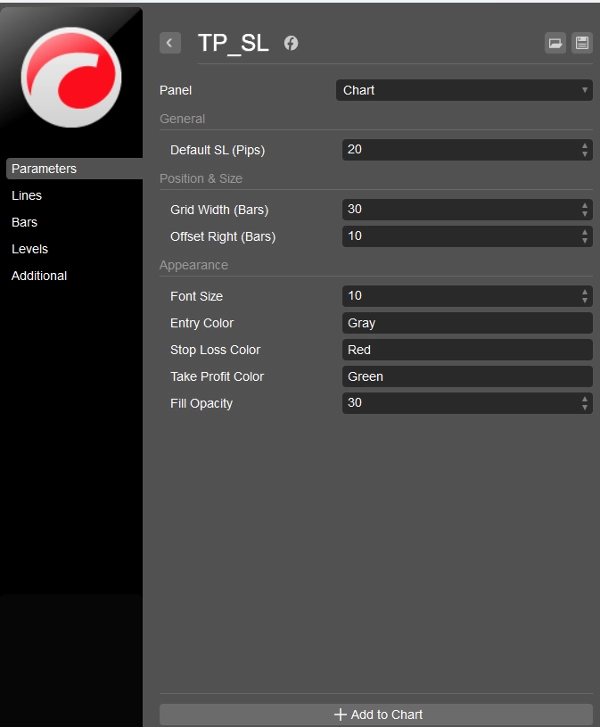
  • Largeur et décalage de la grille : Ajustez la longueur de l'outil (en barres) et sa proximité avec le prix actuel.
  • Visuels : Contrôle total des couleurs. Tapez n'importe quel nom de couleur standard (par ex., DodgerBlue, Orange, Gray) pour les lignes d'Entrée, SL et TP.
  • Opacité : Ajustez la transparence des zones de fond (de 0 à 255) pour un aspect élégant et vitreux.
  • Taille du texte : Adaptez parfaitement les étiquettes sur le graphique à la résolution de votre écran.

Ne devinez plus vos objectifs. Planifiez visuellement vos trades, respectez votre gestion du risque et gardez vos graphiques parfaitement propres !

Cet indicateur est entièrement GRATUIT pour la communauté cTrader.

Résumé

AI summary
TP_SL is a visual risk and reward indicator designed for cTrader that replicates the TradingView-style Long/Short position tool. It enables traders to quickly and intuitively plan trades by drawing and adjusting entry, stop loss, and take profit levels directly on the chart. The tool automatically calculates risk multiples (1R, 2R, 3R, 4R) based on the distance between entry and stop loss, projecting precise take profit zones.

Key features include a smart auto-flip function that switches between long and short positions by dragging the stop loss line above or below the entry line, clean bounded lines that avoid cluttering historical data, and dynamic price tracking that keeps the tool aligned with current price action. Users can draw the setup by holding SHIFT and left-clicking, then adjust levels with drag-and-drop, and delete the drawing with a single key press.

The indicator offers full customization of grid width, offset, colors, opacity, and text size to fit individual chart preferences. It supports visualization on bar-based data and is categorized under pattern indicators with a focus on key levels. TP_SL aims to facilitate precise trade planning and risk management while maintaining clean chart aesthetics.
Profil de l'indicateur
Catégorie de l'indicateur
Modèle
Type de résultat
Visualisation
Exigences en matière de données
Barres seulement

Avis clients

0.0
Avis : 0
Avis clients
Il n'y a pas encore d'avis sur ce produit. Vous l'avez déjà essayé ? Soyez le premier à en parler aux autres !

Discussion

Questions fréquentes

Key Levels
Les produits disponibles sur cTrader Store, notamment les bots de trading, les indicateurs et les plug-ins, sont fournis par des développeurs tiers et mis à disposition à titre informatif et à des fins d'accès technique uniquement. cTrader Store n'est pas un courtier et ne fournit aucun conseil en investissement, aucune recommandation personnelle ni aucune garantie quant aux performances futures.

Plus de cet auteur

Indicateur
AI
Prop
+8
The EMA Trend Simple is a trend-following tool designed for simplicity and visual clarity.
cBot
Prop Firm Fit
Stop Loss (SL) Manager
+1
HTS Strategy Tester - Advanced Multi-Timeframe Trend & Pullback Trading System H1/m1 & H4/m5 WWS 33/144 Start from 100$
90.1%
ROI
2.92
Facteur de profit
Indicateur
AI
Grid
+7
Follow The Trend cBot - INDICATOR - displays two Moving Average Bands for cBot or for your own use
Indicateur
AI
SMC
+7
The ultimate tool for Price Action and ICT. High, Low and Mid levels for days, weeks Inc. NY Midnight and Custom Range.
Indicateur
ATR
Prop
+13
HCCC MTF (Hurst Cycle Composite Channel), Designed for Semi-Automated Trading, Interactive MTF Dashboard
Indicateur
ATR
MACD
+15
MACD Advanced -- It combines the standard MACD logic with a rich set of visual tools
Indicateur
AI
RSI
+7
EMA MTF TREND PRO - Multi-timeframe trend analysis overlay indicator, 6 timeframes - in one table with ADX
Indicateur
AI
Prop
+7
EMA Clouds, Multi-Timeframe (MTF) Overlay, Swing High/Low detection, and a smart Dashboard with neutral zone filtering.
Indicateur
AI
SMC
+4
Weekly Daily Opening Gaps — NWOG & NDOG Indicator Professional-grade opening gap visualization for institutional traders
Indicateur
ATR
Channel
+1
Bollinger Bands Advanced Squeeze & Breakout System, Real-Time On-Chart Dashboard, Auto-Squeeze Detector, Dual-Band Cloud
Indicateur
SMC
Prop
+11
Sessions PRO is a professional session visualization indicator - 4 Fully Customizable Sessions
Logo de "RSI Advanced"
Les mieux notés
5.0
(4)
$20
/
$30
Indicateur
AI
ATR
+12
The standard Relative Strength Index (RSI), RSI & Signal Cloud, Smart Volatility Filter (ATR), On-Chart Info Dashboard

Vous pourriez aussi aimer

Indicateur
ADX
ATR
+5
10 Factors. One Signal. Zero Guesswork.
Indicateur
Track major trading sessions (Tokyo, London, New York) with customizable colors and visual session highlights on your ch
Indicateur
Smart Signal Reversal Trend + Patterns
Indicateur
Volume
Select a price range and read POC, VAH and VAL from tick activity on your cTrader chart.
Indicateur
Forex
BTCUSD
+9
This indicator implements an Opening Range Breakout (ORB) trading strategy, designed to capture momentum during the most
Indicateur
MACD
Prop
+14
Customize the MACD! Choose colors, get real-time tick updates, and see crossover points for enhanced trading precision.
Indicateur
AI
ATR
+26
The Triple Momentum indicator for cTrader is a versatile trend-following tool.
Indicateur
ATR
RSI
+5
Binary Options Signals Pro – Precision Trading at Your Fingertips
Indicateur
ATR
RSI
+9
🚀 MACARX Indicator - The Multi-Indicator Trend Fusion 🚀
Indicateur
Scalping
Adaptive KAMA: fast in trend, slow in noise — with color-coded market state visualization.
Indicateur
Signal
This Fair Value Gap (FVG) indicator is a technical analysis on multi-timeframe.
Indicateur
ATR
Volume
+4
This allows traders to see not just the trend, but whether the momentum itself is overextended.
Indicateur
Prop
Forex
+7
The Parabolic SAR, or "Stop and Reverse," is a dynamic technical analysis tool.
Indicateur
Key Levels
Chart UI Tools
+2
Visualize five major market sessions in GMT with editable times, high-low boxes and directional range lines.
Indicateur
ATR
CCI
+4
A trend line that never steps back, a shaded band to the price, and a pointer at the swing where the trend turns.
Indicateur
Forex
Version 3: Full control of session display including start and end times of all 3 sessions!
Indicateur
MSS
Volume
+3
Rejection-based volume profile with tiered heat zones, POC levels and a fully draggable anchor on cTrader.
Indicateur
Imbalance
Fair Value Gap
+1
Multi-symbol, multi-timeframe Fair Value Gaps in one panel.

Prix

32
Ventes
980
Installations gratuites