
Açıklama
MACD Advanced — Gösterge Açıklaması
MACD Advanced, cTrader için klasik MACD göstergesinin profesyonel bir yükseltmesidir. Standart MACD mantığını zengin görsel araçlar ve analitik katmanlarla birleştirerek, traderlara piyasa momentumu, trend gücü ve volatilite koşulları hakkında çok daha derin bir bakış sunar — hepsi tek bir panelde.
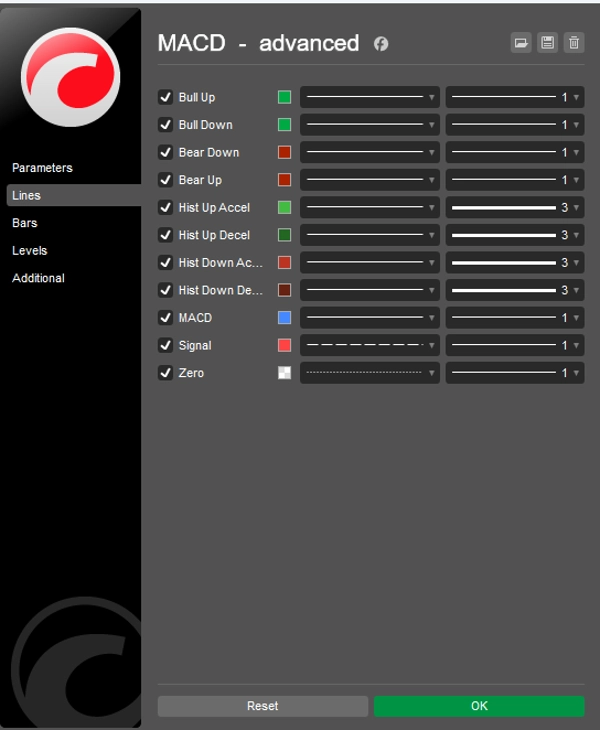
Momentum Renkli Histogram
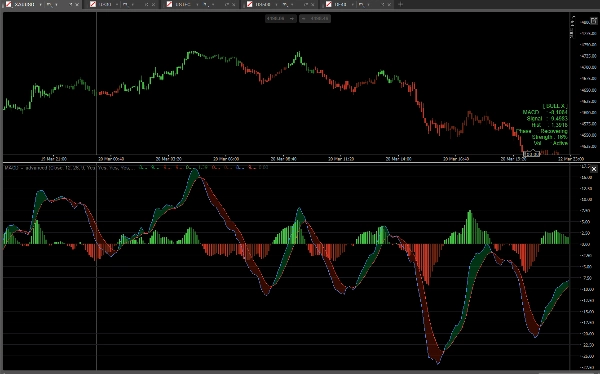
Histogram, MACD ve Sinyal çizgileri arasındaki farkı gösterir ve dört ayrı renk kullanarak dört piyasa durumunu ayırt eder: yükselen ivmeli boğa, azalan ivmeli boğa, yükselen ivmeli ayı ve azalan ivmeli ayı. Bu, momentumu manuel hesaplama yapmadan hemen momentumun artıp azaldığını açıkça gösterir.
MACD Bulutu
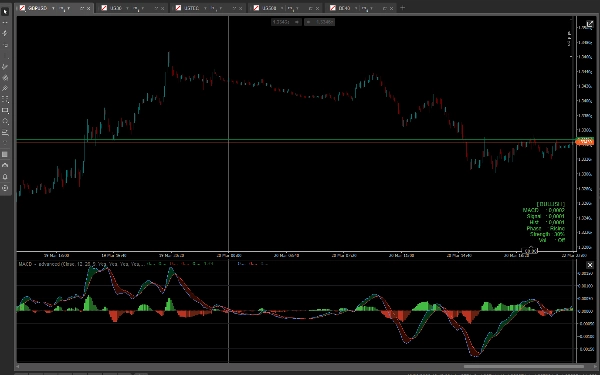
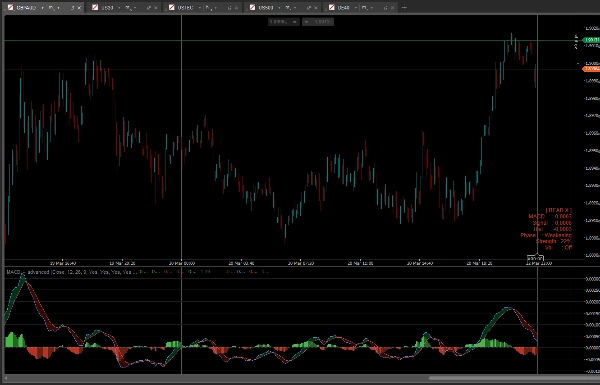
İsteğe bağlı bir bulut, MACD ve Sinyal çizgileri arasındaki alanı doldurur. MACD, Sinyal çizgisinin üzerindeyken yeşil bir bulut (boğa eğilimi), altında olduğunda kırmızı bir bulut (ayı eğilimi) oluşur. Bulut, trend yönünü anında görsel olarak okumanızı sağlar.
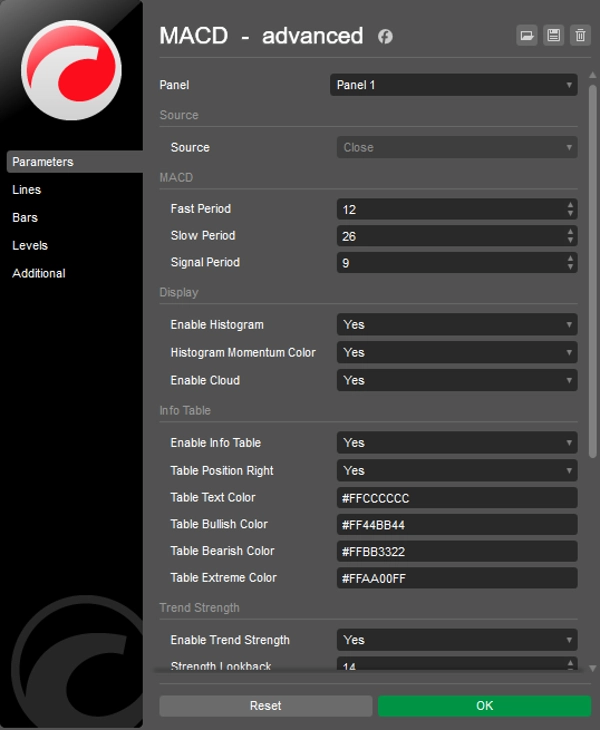
Trend Gücü
Gösterge, yapılandırılabilir bir geriye dönük dönem boyunca MACD ve Sinyal çizgileri arasındaki ayrılığa dayalı gerçek zamanlı bir trend gücü puanı hesaplar. Sonuç, bilgi tablosunda yüzde olarak gösterilir ve mevcut hareketin ne kadar güçlü veya zayıf olduğunu değerlendirmenize yardımcı olur.
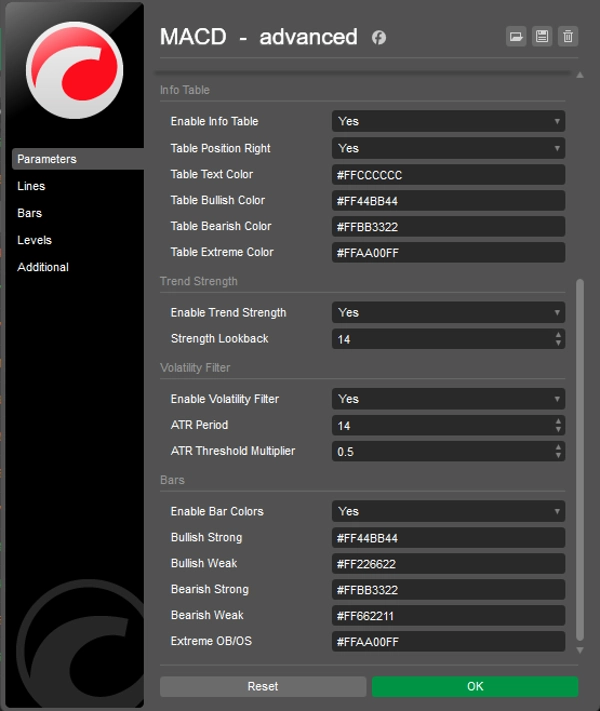
Volatilite Filtresi
İsteğe bağlı ATR tabanlı volatilite filtresi, düşük volatilite dönemlerinde sinyalleri bastırır. Etkinleştirildiğinde, volatilite yapılandırılabilir bir eşik değerinin altına düştüğünde histogram çubukları ve çubuk renkleri nötr griye dönüşür, böylece sakin piyasalarda yanlış okumaların önüne geçilir.
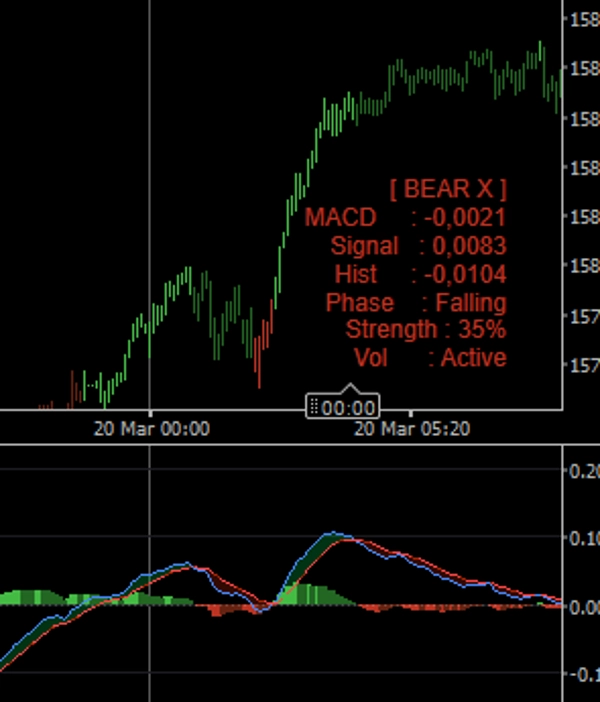
Bilgi Tablosu
Kompakt bir grafik üzeri tablo, mevcut piyasa durumunu (Boğa, Ayı, Boğa Kesişimi, Ayı Kesişimi, Nötr), kesin MACD ve Sinyal değerlerini, histogram değerini, döngü evresini (Yükselen, Zayıflayan, İyileşen, Düşen), trend gücü yüzdesini ve volatilite filtresi durumunu gösterir. Tablo pozisyonu (sol veya sağ) ve tüm renkler tamamen yapılandırılabilir.
Çubuk Renklendirme
Etkinleştirildiğinde, gösterge MACD koşullarına göre grafik mumlarını yeniden renklendirir: güçlü boğa, zayıf boğa, zayıf ayı, güçlü ayı ve düşük volatilite. Bu, MACD sinyalini panel değiştirmeden doğrudan fiyat grafiğine getirir.
Ana Özellikler Özeti
- Dört renkli momentum histogramı
- MACD ve Sinyal çizgileri arasında MACD bulutu
- Gerçek zamanlı yüzde olarak trend gücü puanı
- Görsel geri bildirimli ATR tabanlı volatilite filtresi
- Tam piyasa durumu dökümü ile grafik üzeri bilgi tablosu
- MACD koşullarına dayalı isteğe bağlı mum renklendirme
- Alfa kanal desteği ile tamamen özelleştirilebilir tüm renkler
- Temiz ve hafif — yeniden boyama yok
Özet
Müşteri değerlendirmeleri
5 | 33 % | |
4 | 67 % | |
3 | 0 % | |
2 | 0 % | |
1 | 0 % |


