
Stochastic Momentum Index
Gösterge
1 satın almalar
Sürüm 2.1, Jan 2026
Windows, Mac
4.5
Değerlendirmeler: 2
Başlangıç 31/01/2025
415.05M
İşlem hacmi
2.69M
Kazanılan pip
4
Satışlar
187
Ücretsiz yüklemeler
Açıklama
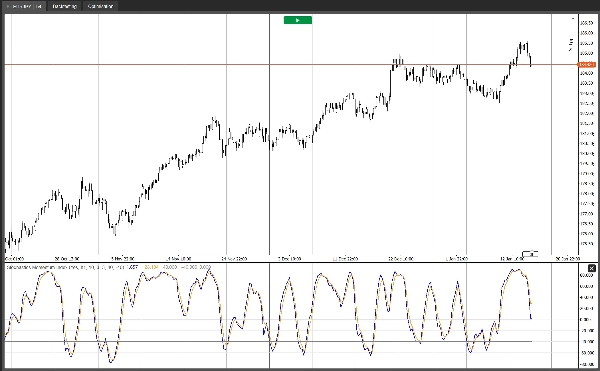
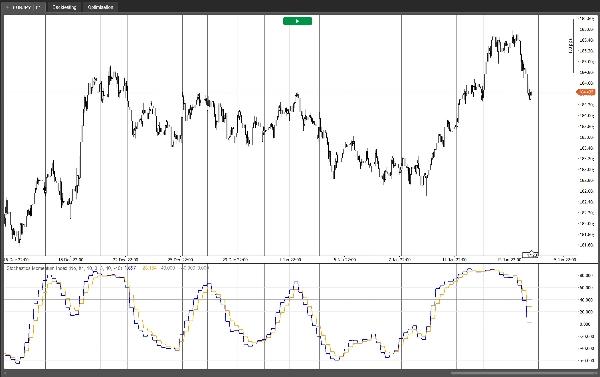
Stokastik Momentum İndeksi (SMI), klasik bir Stokastik'ten daha düzgün bir şekilde momentumu ölçmek için tasarlanmış rafine bir stokastik osilatördür. Bu cTrader uygulaması, hem göreceli aralığa hem de yüksek-düşük aralığına çift EMA yumuşatma uygulayarak, trend ve yatay koşullar arasında iyi çalışan temiz, stabil bir momentum eğrisi üretir ve yaygın olarak kullanılan TradingView formülasyonuyla eşleşir.
Ne gösterir
- SMI, kapanışın son yüksek-düşük aralığının orta noktasına göre nerede olduğunu ölçer, normalize edilmiş ve ölçeklendirilmiştir.
- Değerler genellikle -100 ile +100 arasında salınır.
- Aşırı alım/aşırı satım referans seviyeleri (varsayılan +40 / -40) gerilmiş koşulları ve momentum uç noktalarını belirlemeye yardımcı olur.
Grafikler
- SMI: ana momentum çizgisi.
- SMI tabanlı EMA: kesişmeler ve onay için bir sinyal çizgisi (SMI'nin EMA'sı).
- Aşırı Alım / Aşırı Satım / Orta (0) seviyeleri hızlı görsel bağlam için.
Tüccarlar nasıl kullanır
- Trend rejimleri: Yön filtresi olarak 0 çizgisini kullanın (0'ın üzerinde = boğa baskısı, 0'ın altında = ayı baskısı) ve trend yönünde SMI ile sinyal çizgisi kesişmelerini kullanarak geri çekilmeleri işlem yapın.
- Ortalama dönüş rejimleri: SMI aşırı alım/aşırı satımdan döndüğünde ve bir kesişme ile onayladığında uç noktaları zayıflatın, genellikle ilk ortalama dönüş hedefi olarak 0 çizgisini hedefleyin.
- Uyumsuzluklar: Fiyat ile SMI arasındaki momentum uyumsuzluğu, potansiyel zayıflayan salınımları vurgulayabilir.
Çok zaman dilimli seçenek
- SMI'yi daha yüksek bir zaman diliminden hesaplamak için bir Kaynak Zaman Dilimi seçin ve mevcut grafikte görüntüleyin (gürültüyü filtrelemek ve sinyal kalitesini artırmak için idealdir).
- Ya da hesaplamaları mevcut zaman diliminde tutmak için Grafik Zaman Dilimini Kullan etkinleştirin.
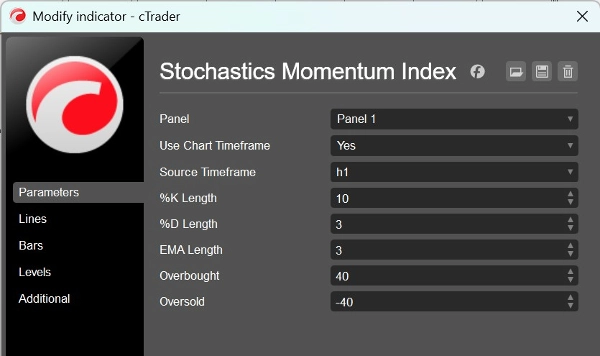
Girdiler
- %K Uzunluğu: en yüksek yüksek / en düşük düşük için geriye dönük pencere.
- %D Uzunluğu: çift EMA hesaplamasında kullanılan yumuşatma uzunluğu.
- EMA Uzunluğu: sinyal çizgisi uzunluğu (SMI'nin EMA'sı).
- Aşırı Alım / Aşırı Satım: referans seviyeleri.
- Grafik Zaman Dilimini Kullan / Kaynak Zaman Dilimi: isteğe bağlı daha yüksek zaman dilimi hesaplaması.
Bu gösterge, ister trend devamını, ister yatay hareketleri işlem yapın ya da SMI'yi daha geniş bir strateji içinde onay filtresi olarak kullanın, gerçek ticaret iş akışları için hafif, stabil ve pratik olacak şekilde tasarlanmıştır.
Özet
YZ özeti
The Stochastic Momentum Index (SMI) indicator for cTrader is a refined momentum oscillator that applies double EMA smoothing to both the relative range and high–low range, producing a smooth and stable momentum curve. It measures the position of the close price relative to the midpoint of the recent high–low range, with values oscillating between -100 and +100. Default overbought and oversold levels are set at +40 and -40, respectively, to highlight momentum extremes.
The indicator plots three key elements: the main SMI momentum line, an EMA-based signal line for crossovers and confirmation, and reference levels for overbought, oversold, and the zero midpoint. Traders use the zero line as a directional filter to identify bullish or bearish pressure and trade pullbacks via SMI and signal line crossovers. It also supports mean-reversion strategies by signaling fades from overbought/oversold conditions and can highlight momentum divergences.
A multi-timeframe option allows calculation of the SMI from a higher timeframe while displaying it on the current chart, helping to filter noise and improve signal quality. User inputs include lookback lengths for %K and %D, signal line EMA length, overbought/oversold levels, and timeframe selection. The indicator is designed for use across various markets including Forex, stocks, commodities, indices, and cryptocurrencies.
Gösterge profili
Müşteri değerlendirmeleri
4.5
Değerlendirmeler: 2
5 | 50 % | |
4 | 50 % | |
3 | 0 % | |
2 | 0 % | |
1 | 0 % |
Müşteri değerlendirmeleri
January 28, 2026
The part worth keeping is the workflow feels calmer, and 2 swing checks is the line to watch.
January 23, 2026
it earns a spot because weak entries have a harder time slipping through, and spread and slippage need a line in the notes.
Tartışma
SSS
BTCUSD
Forex
Signal
Breakout
Indices
EURUSD
Commodities
GBPUSD
NZDUSD
Prop
Scalping
Crypto
Stocks
XAUUSD
NAS100
USDJPY
cTrader Store üzerinden erişilebilen işlem botları, göstergeler ve eklentiler gibi ürünler, üçüncü taraf sağlayıcılar tarafından sağlanır ve yalnızca bilgilendirme ve teknik erişim amaçlarıyla sunulur. cTrader Store bir broker değildir ve yatırım tavsiyesi, kişisel öneriler vermez veya gelecekteki performansı garanti etmez.
Bu oluşturanın diğer ürünleri


!["[CB] Pivot Points Pro" logosu](https://cdn.ctrader.com/image/webp/43463c82-67b0-4f10-a4ba-901bba091d81_32594)


Fiyat
Başlangıç 31/01/2025
415.05M
İşlem hacmi
2.69M
Kazanılan pip
4
Satışlar
187
Ücretsiz yüklemeler