
Keylevels v1.1
อินดิเคเตอร์
1 การซื้อ
เวอร์ชัน 1.0, Nov 2025
Windows, Mac
5.0
รีวิว: 1
คำอธิบาย
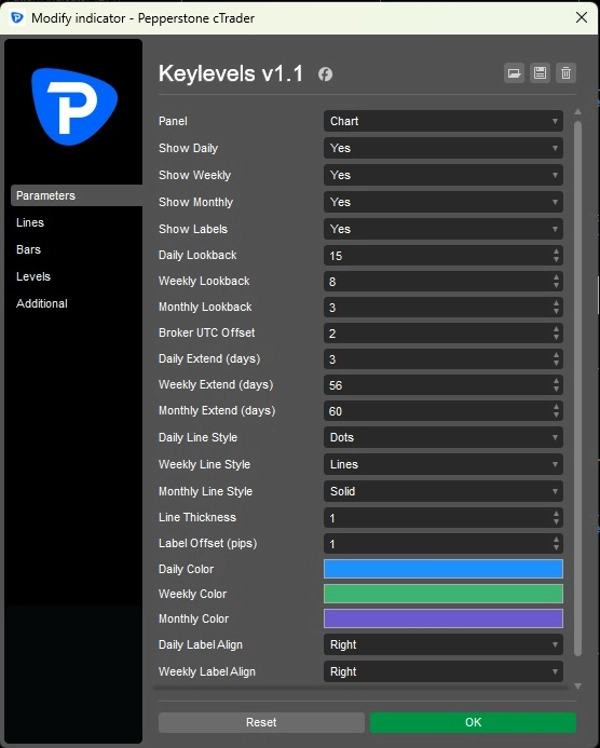
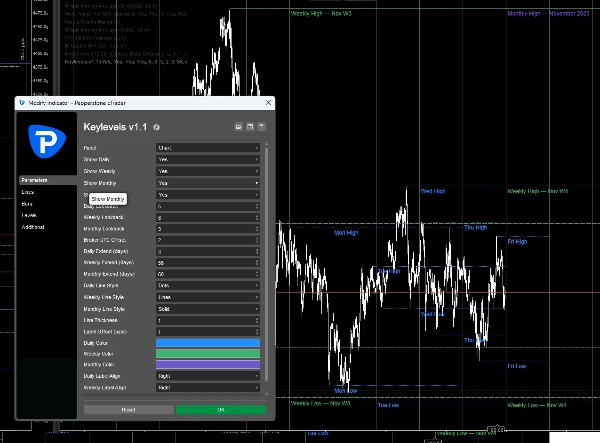
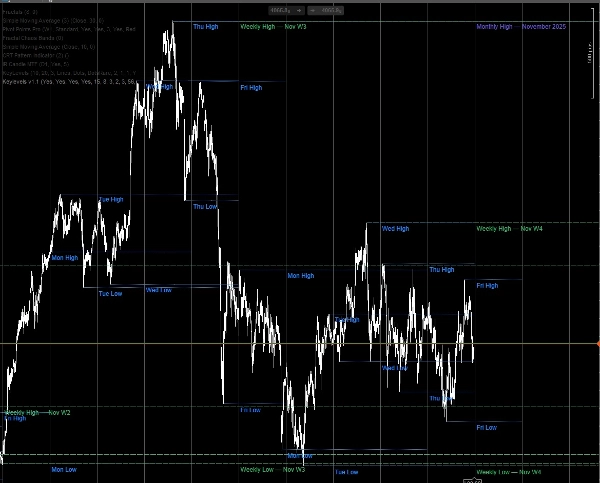
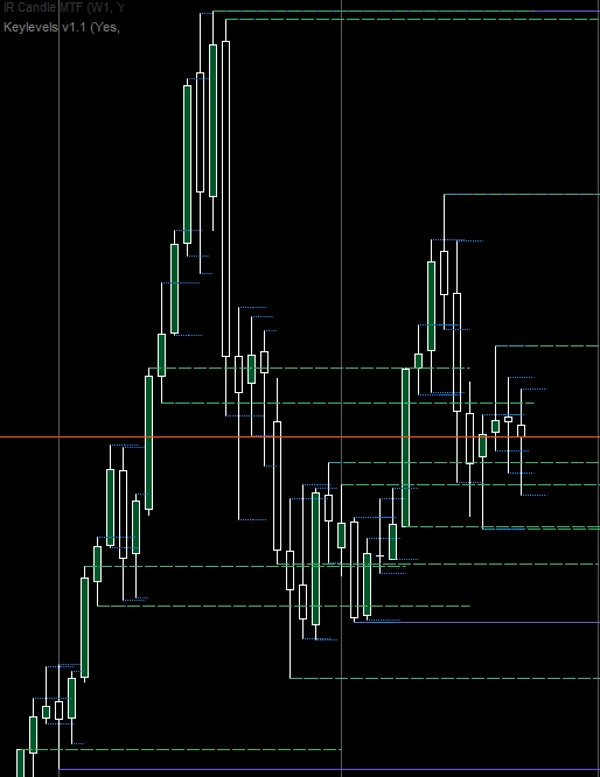
ตัวบ่งชี้ระดับสำคัญ เป็นเครื่องมือที่มีความแม่นยำออกแบบมาสำหรับเทรดเดอร์มืออาชีพที่ต้องการความชัดเจน วินัย และการควบคุมในกระบวนการทำงานของพวกเขา สร้างขึ้นด้วยตรรกะการมองย้อนหลังที่เข้มงวดและการจัดการออฟเซ็ต UTC ของโบรกเกอร์ เพื่อให้แน่ใจว่าระดับสูงสุดและต่ำสุดรายวัน รายสัปดาห์ และรายเดือนถูกวางแผนอย่างแม่นยำตามที่แผนกสถาบันติดตาม
คุณสมบัติหลักได้แก่:
- การควบคุมออฟเซ็ต UTC ของโบรกเกอร์ เพื่อการจัดแนวเซสชันที่แม่นยำข้ามเซิร์ฟเวอร์ต่าง ๆ
- สไตล์เส้นแยกต่างหากสำหรับแต่ละระดับ (รายวัน รายสัปดาห์ รายเดือน) เพื่อความแตกต่างทางสายตาที่ชัดเจน
- การจัดแนวป้ายกำกับที่กำหนดเอง (ซ้าย กลาง ขวา) เพื่อป้องกันการทับซ้อนและรักษาความอ่านง่ายของแผนภูมิ
- การบังคับใช้การมองย้อนหลังอย่างเข้มงวด พร้อมการล้างระดับที่ล้าสมัยอย่างสะอาดหมดจด
- การออกแบบที่เรียบง่ายและไม่รก พร้อมสี ความหนา และออฟเซ็ตป้ายกำกับที่ปรับแต่งได้
ตัวบ่งชี้นี้ถูกออกแบบมาเพื่อความเร็ว ความแม่นยำ และความชัดเจนในกระบวนการทำงาน ไม่ว่าคุณจะกำหนดระดับสถาบันหรือปรับปรุงกระบวนการทางเทคนิคของคุณเอง มันมอบโซลูชันที่แข็งแกร่งและปรับแต่งได้ซึ่งช่วยให้แผนภูมิของคุณสะอาดและการตัดสินใจของคุณเฉียบคม
สรุป
โปรไฟล์อินดิเคเตอร์
รีวิวจากลูกค้า
5.0
รีวิว: 1
5 | 100 % | |
4 | 0 % | |
3 | 0 % | |
2 | 0 % | |
1 | 0 % |
การสนทนา
คำถามที่พบบ่อย
Forex
Signal
Breakout
Indices
EURUSD
Commodities
GBPUSD
NZDUSD
Prop
Scalping
SMC
Stocks
AI
XAUUSD
NAS100
USDJPY
ผลิตภัณฑ์ที่มีให้บริการผ่าน cTrader Store รวมถึงบอทการเทรด อินดิเคเตอร์ และปลั๊กอิน มีให้บริการโดยนักพัฒนาบุคคลที่สามและมีไว้เพื่อวัตถุประสงค์ในการเข้าถึงข้อมูลและทางเทคนิคเท่านั้น cTrader Store ไม่ใช่โบรกเกอร์และไม่ได้ให้คำแนะนำการลงทุน คำแนะนำส่วนบุคคล หรือการรับประกันผลการดำเนินงานในอนาคต
เพิ่มเติมจากผู้เขียนคนนี้


ราคา
ตั้งแต่ 24/04/2025
168.09M
ปริมาณการเทรด
17.73K
Pips ที่ได้กำไร
11
การขาย
328
ติดตั้งฟรี