
คำอธิบาย
ปฏิวัติการวิเคราะห์แผนภูมิของคุณ
ก้าวเข้าสู่อนาคตของการวิเคราะห์ทางเทคนิคด้วย Delta-RSI Candle Pro – ตัวบ่งชี้นวัตกรรมที่เปลี่ยนแท่งเทียนธรรมดาให้กลายเป็นตัวแสดงแรงขับเคลื่อนที่ทรงพลัง ทำไมต้องรกหน้าจอด้วยตัวบ่งชี้หลายตัวในเมื่อคุณสามารถมีทุกอย่างที่ต้องการได้บนแท่งเทียนเอง?
โซลูชันการเทรดด้วยภาพแบบครบวงจร
-
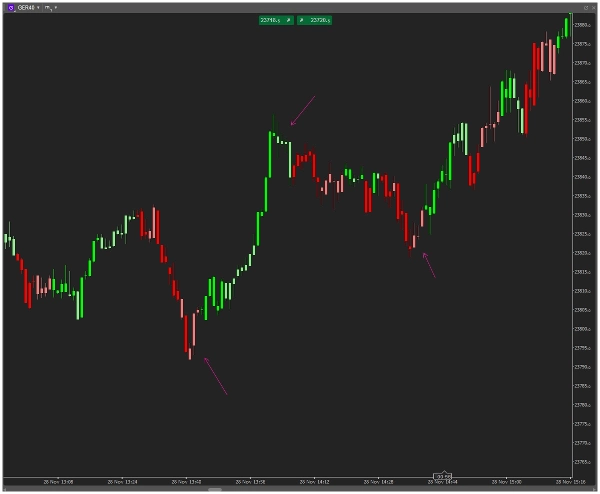
- การรับรู้สัญญาณทันที: แสดงความแรงและทิศทางของแรงขับเคลื่อนอย่างชัดเจนผ่านสี
- เพิ่มพื้นที่หน้าจอให้เต็มที่: กำจัดแผงออสซิลเลเตอร์แยกออกไปตลอดกาล
- ความแม่นยำทางคณิตศาสตร์: การถดถอยพหุนามขั้นสูงคำนวณแรงขับเคลื่อน RSI ที่แท้จริง
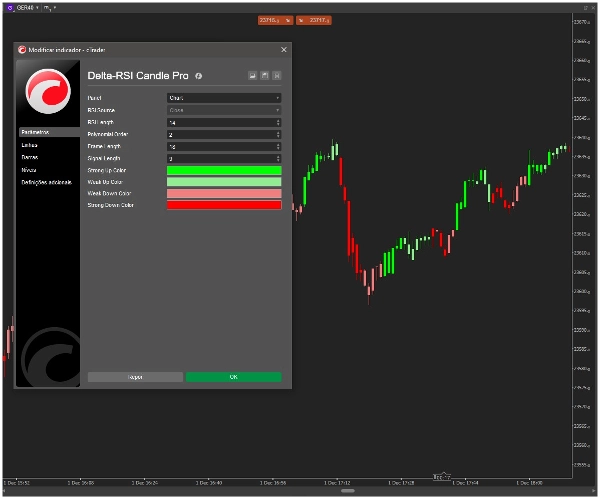
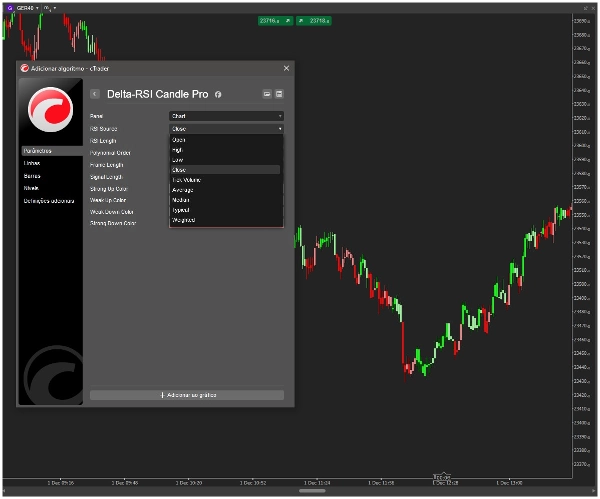
- ปรับแต่งได้อย่างสมบูรณ์: ใช้ตัวเลือกสีเนทีฟของ cTrader เพื่อให้เข้ากับสไตล์การเทรดของคุณ
- เชื่อถือได้ & แม่นยำ: การคำนวณที่ไม่ทาสีซ้ำโดยอิงจากข้อมูลราคาที่ได้รับการยืนยัน
วิธีการทำงานของ Delta-RSI Candle Pro
อัลกอริทึมเฉพาะของเราคำนวณ อนุพันธ์ทันทีของ RSI โดยใช้การฟิตโค้งพหุนาม จากนั้นกำหนดสีอัจฉริยะให้กับแต่ละแท่งเทียน:
-
- กระทิงแรงกล้า: สีเขียวเข้ม – แรงขับเคลื่อนบวกเร่งตัว
- กระทิงอ่อน: สีเขียวอ่อน – แรงขับเคลื่อนบวกแต่ควรระวัง
- หมีอ่อน: สีแดงอ่อน – แรงขับเคลื่อนลบแต่มีโอกาสกลับตัว
- หมีแรงกล้า: สีแดงเข้ม – แรงขับเคลื่อนลบเร่งตัว
คุณสมบัติเด่นที่ทำให้เราแตกต่าง
-
- 🎯 การผสานแท่งเทียนโดยตรง: สีปรากฏโดยตรงบนแท่งเทียนการเทรดของคุณ
- 🎨 การเลือกสีด้วยภาพ: ตัวเลือกสี cTrader ที่ใช้งานง่าย – ไม่ต้องใช้ชื่อโค้ด
- ⚙️ ปรับแต่งได้เต็มที่: ปรับความยาว RSI, ลำดับพหุนาม และช่วงเวลาย้อนหลังได้
- 🚀 ประสิทธิภาพที่ได้รับการปรับแต่ง: เครื่องยนต์คำนวณน้ำหนักเบาสำหรับการทำงานที่ราบรื่น
- 📊 อัลกอริทึมระดับมืออาชีพ: การวิเคราะห์อนุพันธ์ทางคณิตศาสตร์เพื่อสัญญาณที่เหนือกว่า
ใครได้ประโยชน์มากที่สุด?
-
- นักเทรดรายวัน ที่ต้องการสัญญาณแรงขับเคลื่อนแบบทันที
- นักเทรดสวิง ที่ต้องการระบุการเปลี่ยนแปลงแนวโน้มแต่เนิ่นๆ
- นักเทรดมินิมัลลิสต์ ที่เกลียดความรกของแผนภูมิ
- นักเทรดเชิงอัลกอริทึม ที่ต้องการการยืนยันด้วยภาพ
- นักเทรดจริงจังทุกคน ที่ต้องการความได้เปรียบในการวิเคราะห์ตลาด
เริ่มต้นในไม่กี่วินาที
-
- เพิ่ม Delta-RSI Candle Pro ลงในแผนภูมิของคุณ
- เลือกสีที่คุณชอบโดยใช้ตัวเลือกสีแบบภาพ
- ปรับพารามิเตอร์ให้ตรงกับกรอบเวลาการเทรดของคุณ
- เห็นรูปแบบแรงขับเคลื่อนปรากฏบนแท่งเทียนของคุณทันที
ความเป็นเลิศทางเทคนิค
-
- ประเภทตัวบ่งชี้แบบซ้อนทับ (ไม่มีแผงแยก)
- อัลกอริทึมที่ไม่ทาสีซ้ำ
- การคำนวณอนุพันธ์พหุนามของ RSI
- เข้ากันได้กับสัญลักษณ์และกรอบเวลาทั้งหมด
- อัปเดตและปรับปรุงอย่างสม่ำเสมอ
ทำไมสิ่งนี้จึงแตกต่าง
ในขณะที่ตัวบ่งชี้อื่นๆ เพิ่มความซับซ้อน Delta-RSI Candle Pro ทำให้เรียบง่ายและเพิ่มประสิทธิภาพ เราได้นำการวิเคราะห์แรงขับเคลื่อนทางคณิตศาสตร์ขั้นสูงมาทำให้เข้าใจได้ด้วยภาพ ไม่ต้องแบ่งความสนใจระหว่างราคาและตัวบ่งชี้อีกต่อไป – ตอนนี้พวกมันทำงานร่วมกันเป็นระบบเดียวที่สอดคล้องกัน
พร้อมที่จะเห็นแผนภูมิของคุณในรูปแบบใหม่ที่ปฏิวัติวงการหรือยัง?...
สรุป
Key features include immediate visual signal recognition through candle coloring, elimination of separate oscillator panels to maximize chart space, and advanced mathematical precision with non-repainting calculations based on confirmed price data. Users can fully customize colors and parameters such as RSI length, polynomial order, and lookback period using cTrader’s native color pickers.
Delta-RSI Candle Pro is compatible with all symbols and timeframes and is optimized for smooth performance with a lightweight calculation engine. It is suitable for day traders, swing traders, minimalist traders, algorithmic traders, and others seeking clear, integrated momentum analysis without chart clutter. The indicator overlays directly on price candles, providing a cohesive system that combines price and momentum information visually.
รีวิวจากลูกค้า
5 | 100 % | |
4 | 0 % | |
3 | 0 % | |
2 | 0 % | |
1 | 0 % |


