

present
Daftar dan dapatkan diskon $50 untuk pembelian pertama Anda
Trading product for Smart Donchian Cloud Indikator Premium/Discount  Donchian Channels, image 1
Smart Donchian Cloud
Indikator
Versi 1.0, Apr 2026
Windows, Mac
4.6
Ulasan: 3
Trading product for Smart Donchian Cloud Indikator Premium/Discount  Donchian Channels, image 2
Trading product for Smart Donchian Cloud Indikator Premium/Discount  Donchian Channels, image 3
Trading product for Smart Donchian Cloud Indikator Premium/Discount  Donchian Channels, image 4
Sejak 14/02/2025
17
Penjualan

Deskripsi

Visualisasi Dukungan & Perlawanan Institusional

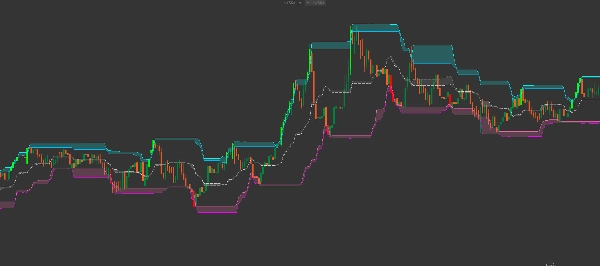
The Smart Donchian Cloud Reversal adalah saluran volatilitas generasi berikutnya yang dirancang untuk mengidentifikasi zona pembalikan dengan probabilitas tinggi. Berbeda dengan Saluran Donchian standar yang hanya melacak tertinggi tertinggi dan terendah terendah, indikator ini menganalisis hubungan antara sumbu lilin dan badan lilin untuk memplot "Awan Tekanan."

Awan-awan ini berfungsi sebagai zona Dinamis Penawaran dan Permintaan, menunjukkan dengan tepat di mana pasar kemungkinan akan berhenti atau berbalik.


Arsitektur Multi-Awan Lanjutan

Indikator ini menampilkan sistem awan 3 lapis yang canggih:

    1. Awan Perlawanan (Sian/Biru): Terletak di atas, ini memvisualisasikan celah antara sumbu tertinggi dan badan lilin tertinggi. Ini adalah "Zona Penjualan."
    2. Awan Keseimbangan (Abu-abu/Perak): Pita tengah yang melacak keseimbangan pasar. Ini mewakili titik tengah nilai wajar antara sumbu dan badan.
    3. Awan Dukungan (Merah Muda/Magenta): Terletak di bawah, ini memvisualisasikan celah antara sumbu terendah dan badan lilin terendah. Ini adalah "Zona Pembelian."


Fitur Perdagangan Utama

    • Filter Volatilitas ATR: Termasuk pengali ATR (Average True Range) bawaan untuk sedikit menggeser pita luar, menyaring kebisingan pasar dan "perburuan stop."
    • Pewarnaan Lilin Pintar: Indikator secara otomatis menyoroti momentum breakout:
    • Lilin LIME: Harga telah ditutup di atas Awan Perlawanan Atas (Breakout Bullish).
    • Lilin MERAH: Harga telah ditutup di bawah Awan Dukungan Bawah (Breakout Bearish).
    • Logika Sumbu vs. Badan: Dengan melihat ketebalan "awan", Anda dapat mengukur volatilitas. Awan tebal berarti sumbu panjang (penolakan/ketidakpastian tinggi), sementara awan tipis berarti aksi harga yang kuat dan tegas.


Cara Berdagang dengan Smart Donchian Clouds

1. Reversi Rata-Rata (Scalping) » Cari harga yang masuk ke Awan Perlawanan tanpa menutup di atasnya. Ini sering menunjukkan "fakeout," menandakan entri short dengan probabilitas tinggi kembali ke Garis Tengah.

2. Breakout Tren » Ketika sebuah lilin berubah menjadi Lime (menutup di atas filter sumbu atas), itu menandakan bahwa para bulls telah melewati zona perlawanan. Ini adalah sinyal kuat untuk strategi mengikuti tren.

3. Pantulan Dukungan »Perhatikan Awan Dukungan (Merah Muda). Ketika harga menyentuh zona ini selama penarikan dalam tren naik, ini mewakili area "Pembelian Bernilai" di mana pembeli institusional sering masuk.


Parameter Teknis

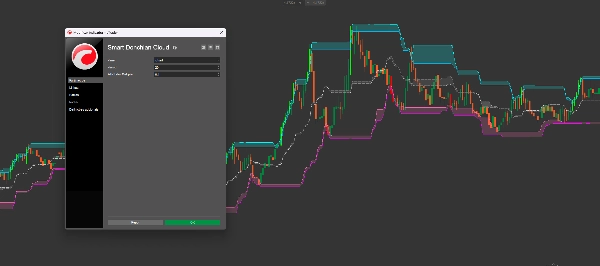
    • Periode: Periode lookback untuk menghitung tertinggi dan terendah (Default: 20).
    • Pengali Filter ATR: Menyesuaikan "padding" di sekitar ekstrem untuk menghindari terjebak dalam lonjakan kecil.
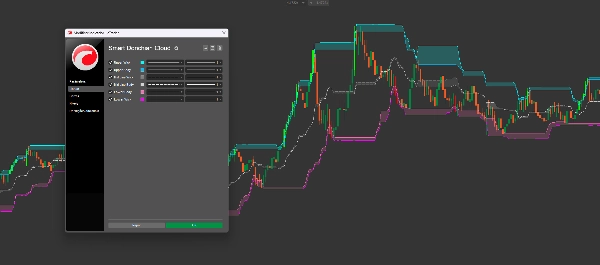
    • Warna yang Sepenuhnya Dapat Disesuaikan: Sesuaikan awan Atas, Tengah, dan Bawah agar sesuai dengan template grafik pribadi Anda.


Mengapa Alat Ini Penting

Kebanyakan trader gagal karena mereka memperlakukan Dukungan dan Perlawanan sebagai garis tunggal. Sebenarnya, mereka adalah Zona. The Smart Donchian Cloud Reversal memetakan zona-zona ini secara matematis, memberi Anda gambaran struktur pasar yang lebih jelas daripada indikator saluran tradisional mana pun.

Ringkasan

AI summary
The Smart Donchian Cloud is a volatility channel indicator designed to visualize institutional supply and demand zones as dynamic support and resistance areas. It analyzes the relationship between candle wicks and bodies to plot three distinct "Pressure Clouds": the Resistance Cloud (cyan/blue) marking the selling zone, the Equilibrium Cloud (gray/silver) representing market balance, and the Support Cloud (pink/magenta) indicating the buying zone. This multi-layer cloud system helps identify high-probability reversal zones and market structure more effectively than traditional Donchian Channels.

Key features include an ATR-based volatility filter to reduce noise, and smart candle coloring that highlights breakout momentum—lime candles signal bullish breakouts above resistance, while red candles indicate bearish breakouts below support. The thickness of the clouds reflects volatility, with thicker clouds showing higher rejection or indecision.

Traders can use the indicator for mean reversion by spotting price entering but not closing above resistance, trend breakouts confirmed by lime candles, and support bounces where price touches the support cloud during pullbacks. The indicator’s parameters, such as lookback period and ATR multiplier, are customizable, along with cloud colors to fit user preferences.
Profil indikator
Kategori indikator
Support & resistance
Tipe output
Visualisasi
Filter
Persyaratan data
Hanya batang
Sinyal yang didukung
Breakout
Reversal
Kekuatan tren
Level tersentuh
Level tertembus

Ulasan pelanggan

4.6
Ulasan: 3
5
67 %
4
33 %
3
0 %
2
0 %
1
0 %
Ulasan pelanggan
April 28, 2026
The first week should show if it adds clarity, and one glance should not run the trade.
April 27, 2026
April 26, 2026
Two sessions say more than one clean chart. The signal gets compared with context.

Diskusi

Pertanyaan umum

Premium/Discount
Donchian Channels
Market Structure
Supply & Demand
Channel
ATR
Support & Resistance
Produk-produk yang tersedia melalui cTrader Store, termasuk bot trading, indikator, dan plugin, disediakan oleh pengembang pihak ketiga serta hanya ditujukan untuk akses teknis dan informasi. cTrader Store bukan broker dan tidak menyediakan saran investasi, rekomendasi pribadi, atau jaminan apa pun tentang kinerja di masa mendatang.

Produk lain dari penulis ini

Indikator
ATR
SMC
+5
Candles Volume Delta is a powerful, visually intuitive indicator that transforms raw tick volume into actionable trading
Indikator
Volume
Order Block
+1
Elevate your market analysis with the Aggression Delta Volume Profile, a premium, institutional-grade order flow utility
Indikator
ATR
Key Levels
It combines the trend-filtering power of Renko charts with the volatility tracking of ATR Bands
Indikator
ATR
RSI
+5
Delta RSI Candle Pro, the indicator that transforms ordinary candlesticks into powerful momentum visualizers.
Logo "Vwap Bands"
Peringkat teratas
4.5
(4)
$19
/
$29
Indikator
VWAP
Moving Average
Vwap Bands it is highly sought after by professional traders because it includes Standard Deviation Bands
Indikator
ATR
Volume
+4
This allows traders to see not just the trend, but whether the momentum itself is overextended.
Indikator
Channel
Moving Average
+2
This is a high-quality implementation of the Squeeze Momentum Candle logic applied directly to candle coloring.
Indikator
ATR
VWAP
+2
Volume-Weighted Trend System that combines VWMA with ATR for volatility filtering.

Anda mungkin juga suka

Indikator
Market Sessions
Indikator
Signal
Trades Opening Range Breakouts Indicator with dynamic stops/targets adapting to market volatility.
Indikator
ATR
Prop
+14
Optimize exits with Chandelier Exit! Visualize stop-loss points dynamically for improved trading precision and safety.
Indikator
ATR
BOS
+5
Full ICT/SMC 4-step setup checker that alerts a long or short setup.
Indikator
BOS
CHOCH
+5
A professional-grade cTrader indicator for traders following the Inner Circle Trader (ICT) methodology.
Indikator
Forex
EURUSD
+3
ATR-normalized MA slope in degrees, comparable across all instruments. Color-coded labels flag strong trend moves.
Indikator
ATR
EMA
+3
The UTBot you know from TradingView — now on cTrader with confirmed signals, VWAP, EMA and session overlays.
Indikator
ATR
The Tenkan-ATR Indicator is a powerful and innovative indicator for Traders. SALE OFF!!!
Indikator
Forex
BTCUSD
+11
Visualize trends with Standard Deviation Channel! Display median, and add customizable upper/lower deviation channels.
Indikator
Volume
Key Levels
+2
Support and resistance from a rolling volume profile, ranked by strength or recency, updated live.
Indikator
MACD
Forex
+6
Auto Signal BUY SELL is a professional decision-making tool designed to help you follow the trend and capture high-proba
Indikator
Volume
Custom range volume profile between two draggable anchors. Auto source timeframe, Total/Up-Down/Delta, POC, Value Area.
Indikator
RSI
RSI on the main chart with 45/55 momentum levels, overbought/oversold levels, averaged RSI, and multi-timeframe support.
Indikator
Breakout
FlexSR auto‑detects pivot highs/lows to plot dynamic support & resistance lines Features customizable styling and option
Indikator
ADX
ATR
+2
GOLD SENTINEL v1.0 - A CANDLE-COLORING INDICATOR FOR GOLD.
Indikator
Volume
Key Levels
+5
Volume Profile Pro v2 - A Lightweight and Highly Customizable Side & Range Volume Profile
Indikator
Doji
Volume
+5
Instantly spot high-liquidity institutional moves with clean, non-obtrusive triangle alerts on cTrader charts.
Indikator
SMC
Prop
+15
Automatic Elliott Wave Detection with Professional Filters

Harga

Sejak 14/02/2025
17
Penjualan

























