present
Registrati e ricevi uno sconto da $50 sul tuo primo acquisto
Trading product for Tradingfcs_vwap Indicatore VWAP Support & Resistance, image 2
Trading product for Tradingfcs_vwap Indicatore VWAP Support & Resistance, image 3
Trading product for Tradingfcs_vwap Indicatore VWAP Support & Resistance, image 4
Trading product for Tradingfcs_vwap Indicatore VWAP Support & Resistance, image 5
Trading product for Tradingfcs_vwap Indicatore VWAP Support & Resistance, image 6
Da 05/07/2026
38.9M
Volume negoziato
327.09K
Profitto in pip

Descrizione

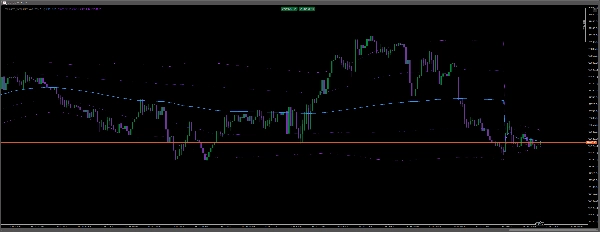
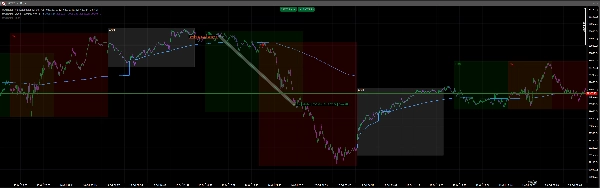
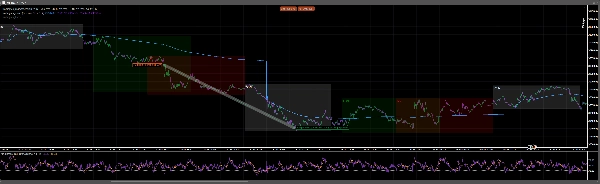
  • 🔵 Linea VWAP Blu: Rappresenta il prezzo medio ponderato per il volume, aiutando a identificare la direzione del mercato intraday e il supporto o la resistenza dinamici.


  • 🟣 Bande di Deviazione Viola: Evidenziano le aree in cui il prezzo si è allontanato dalla sua media, aiutando i trader a identificare potenziali situazioni di eccesso e opportunità di inversione.


  • 📈 Rifiuti di Prezzo: Il grafico H1 evidenziato illustra come le reazioni del prezzo attorno al VWAP possano precedere movimenti rialzisti o ribassisti.


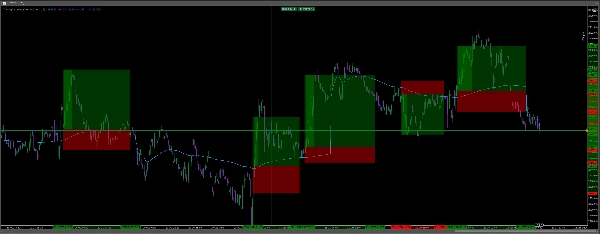
⏰ Sessioni di Trading: Le tue sovrapposizioni separate delle sessioni identificano i periodi di trading asiatici, di Londra e di New York, aiutandoti a valutare le opportunità durante diverse condizioni di mercato.

----------------------------------


Come Aiuta i Trader a Individuare le Opportunità

🟢 Opportunità di ACQUISTO: Quando il prezzo si mantiene sopra il VWAP e lo ritesta con successo come supporto, i trader possono cercare una continuazione rialzista.

🔴 Opportunità di VENDITA: Quando il prezzo scambia sotto il VWAP e lo respinge come resistenza, i trader possono identificare una potenziale continuazione ribassista.

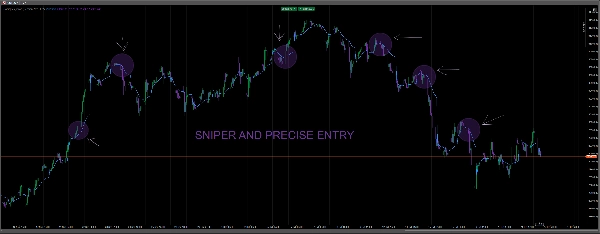
⚡ Scalping di Precisione: Nei timeframe M1 e M5, il VWAP aiuta i trader a identificare potenziali ingressi, ritracciamenti e uscite utilizzando l’azione del prezzo e la conferma del momentum

Riepilogo

Riepilogo AI
Tradingfcs_vwap is a technical indicator designed to assist traders in identifying intraday market trends and potential trade entries using the Volume Weighted Average Price (VWAP). It features a blue VWAP line that reflects the average trading price weighted by volume, serving as a dynamic support or resistance level. Purple deviation bands highlight price movements away from the VWAP, indicating possible overextensions and reversal points.

The indicator also visualizes price rejections on the hourly chart, showing how price interactions with the VWAP can signal bullish or bearish moves. Separate overlays mark the Asian, London, and New York trading sessions, enabling traders to assess market behavior across different periods.

Key trading signals include:
- Buy opportunities when price holds above VWAP and retests it as support.
- Sell opportunities when price trades below VWAP and rejects it as resistance.
- Precision scalping on 1- and 5-minute timeframes by identifying entries, pullbacks, and exits through price action and momentum confirmation.

This tool supports analysis based on volume, support and resistance, and trend strength, using bar data inputs and providing signal outputs for enhanced decision-making in various trading styles.
Profilo indicatore
Categoria indicatore
Supporto e resistenza
Tipo di output
Segnali
Requisiti per i dati
Solo barre
Segnali supportati
Forza del trend

Discussioni

Recensioni dei clienti

4.0
Recensioni: 1
5
0 %
4
100 %
3
0 %
2
0 %
1
0 %
Recensioni dei clienti
October 22, 2026
VWAP and deviation bands give the H1 rejection examples a clear reference. Session overlays add timing, and the description distinguishes holding above the average from rejecting below it. A useful context view rather than one mechanical rule for every band touch.

Domande frequenti

VWAP
Support & Resistance
I prodotti disponibili tramite cTrader Store, inclusi bot di trading, indicatori e plugin, sono forniti da sviluppatori terzi e resi disponibili esclusivamente a scopo informativo e di accesso tecnico. cTrader Store non è un broker e non fornisce consulenze in materia di investimento, raccomandazioni individualizzate o garanzie di risultati futuri.

Potrebbe interessarti anche
Indicatore
Key Levels
Outside Bar
OutsideBar range zones, candle countdown, custom watermark and quick controls.
Indicatore
ATR
EMA
+5
Signals when a burst beyond its ATR band stalls, rated 0-10, with liquidity clusters, session ranges and a full webhook
Indicatore
BOS
MSS
+5
WinSMC is an overlay SMC indicator for cTrader. It helps you visually identify!
Indicatore
ATR
RSI
+11
This indicator puts three helpful trading tools on your chart at once. Think of it like having three expert traders
Indicatore
BOS
Volume
+5
The Volume Delta Indicator using Institutional Level 2 DOM Data, The Edge Institutions Pay Millions For, now on cTrader
Indicatore
BB Breakout Oscillator with alerts! Spot trend reversals using Bollinger Bands. Bullish/Bearish crossovers Alerts.
Indicatore
AI
SMC
+18
ICT HTF Candles- The Ultimate Multi-Timeframe Dashboard Stop switching timeframes and losing focus.
Indicatore
ATR
SMC
+5
Candles Volume Delta is a powerful, visually intuitive indicator that transforms raw tick volume into actionable trading
Indicatore
BOS
Fibonacci
+4
Automatically draws major trading sessions, killzones, and SMC daily liquidity targets directly on your cTrader charts.
Indicatore
Volume
Channel
+2
Identify key support and resistance levels through detailed volume distribution analysis.
Indicatore
SMC
VWAP
+4
Killzone Session and key levels with VWAP – Precision Meets Price Action
Indicatore
ATR
BOS
+5
Market structure with BOS and CHoCH, order blocks, and retest buy/sell arrows with entry, stop and two targets
Indicatore
ATR
Volume
+3
Volume profile key levels - POC, value area, volume peaks and troughs - with break, rejection and retest signals
Indicatore
VWAP
Volume
+3
Don't trust static support and resistance levels, this indicator combines Fibonacci and VWAP in one powerful tool.
Indicatore
AI
SMC
+17
Smart Support/Resistance lines auto calculated from D1/H4/H1/M15. Highly customizable visuals + built in Backtest Mode.
Indicatore
Forex
Indices
+1
Professional Fair Value Gaps with multitimeframe spot on
Indicatore
Key Levels
Trend-filtered signals, transparent trade plans and a multi-timeframe decision panel for cTrader.
Indicatore
ATR
Prop
+15
Initial Range – Where the open writes the script.

Prezzo

Da 05/07/2026
38.9M
Volume negoziato
327.09K
Profitto in pip