
Descrizione
Dinamiche Avanzate di Tendenza con Oscillatore Bollinger Bands
Il Squeeze Pro: Momentum & Volatility Suite è un set di strumenti di livello istituzionale per cTrader. A differenza degli indicatori standard, questa suite fornisce un'analisi a doppio livello del comportamento del mercato: identifica la Fase di Squeeze (compressione del mercato) e monitora gli Estremi di Momentum utilizzando le Bollinger Bands calcolate direttamente sull'oscillatore stesso.
Innovazioni Chiave
-
- Momentum Bollinger Bands: Le prime nel loro genere. Applicando le BB all'istogramma del momentum, puoi identificare livelli di momentum "ipercomprato" o "ipervenduto"—perfetto per temporizzare le uscite prima che la tendenza si esaurisca.
- Rilevamento Squeeze a Tre Stati:
-
- Punti Neri (Squeeze Attivo): Alta compressione. Il mercato si sta "avvolgendo" per un breakout massiccio.
- Punti Grigi (Squeeze Disattivo): La volatilità si sta espandendo. Il movimento è iniziato.
- Punti Blu (Nessuno Squeeze): Condizioni di mercato normali.
- Smussatura con Regressione Lineare: Utilizza un raffinato
CalculateLinearRegressionalgoritmo per filtrare il rumore del prezzo, fornendo un istogramma liscio e affidabile. - Logica a Doppio Overlay: Opera in una finestra indicatore separata per mantenere pulito il grafico dei prezzi fornendo al contempo approfondimenti analitici profondi.
Guida all'Intelligenza Visiva:
-
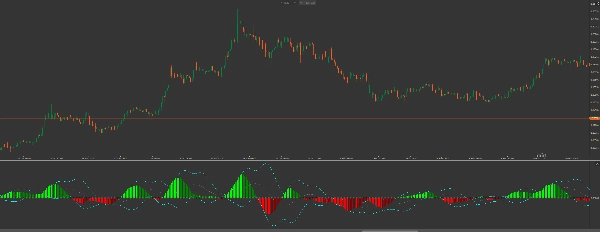
- L'Istogramma (Tendenza & Forza)
-
- Lime: Il momentum rialzista sta accelerando (Forte Acquisto).
- Verde: Il momentum rialzista sta rallentando (Realizzazione Profitti).
- Rosso: Il momentum ribassista sta accelerando (Forte Vendita).
- Marrone Scuro: Il momentum ribassista sta rallentando (Venditori Esausti).
- Le Bande dell'Oscillatore (Le Linee "Cyan")
-
- Quando le barre dell'istogramma superano le Bande di Bollinger Cyan, la tendenza attuale è a un estremo statistico. Cerca inversioni o forti ritracciamenti quando l'istogramma inizia a ritirarsi all'interno di queste bande.
Strategia di Trading: Il "Power Breakout"
-
- Identifica lo Squeeze: Aspetta che appaiano Punti Neri sulla linea zero. Questo indica la "calma prima della tempesta."
- Conferma la Direzione: Cerca la prima barra dell'istogramma Lime (Acquisto) o Rosso (Vendita).
- Il Trigger: Entra nel trade quando appare lo Squeeze Disattivo (punto grigio), segnalando il rilascio di energia.
- L'Uscita: Prendi profitto quando l'istogramma cambia da Lime a Verde, OPPURE quando l'istogramma raggiunge la Banda Superiore dell'Oscillatore, segnalando esaurimento.
Perché Aggiornare a Squeeze Pro?
Mentre gli indicatori di base ti mostrano dove è andato il prezzo, Squeeze Pro ti mostra la pressione dietro il movimento. Vedendo simultaneamente lo squeeze e le bande di momentum, eviti di entrare in tendenze già esaurite e catturi i movimenti esplosivi che altri perdono.
Nota dello Sviluppatore: Questo indicatore è altamente ottimizzato per l'API di cTrader, garantendo zero ritardi nelle prestazioni anche su macchine di fascia bassa mentre gestisce calcoli complessi di regressione lineare in tempo reale.
Riepilogo
Key features include linear regression smoothing to reduce price noise, a dual-overlay display that keeps the price chart uncluttered, and a color-coded histogram that visually represents bullish and bearish momentum strength and changes. When histogram bars move outside the oscillator’s Bollinger Bands (cyan lines), it signals statistically extreme momentum levels, useful for timing entries and exits.
The indicator supports a "Power Breakout" trading strategy: traders wait for squeeze signals, confirm momentum direction via histogram colors, enter trades on squeeze release, and exit when momentum shows signs of exhaustion. This suite provides institutional-grade insights into trend pressure and momentum dynamics, helping traders identify potential explosive moves and avoid exhausted trends.
Recensioni dei clienti
5 | 0 % | |
4 | 100 % | |
3 | 0 % | |
2 | 0 % | |
1 | 0 % |


