
설명
차트 혼잡 없이 시장 변동성 마스터하기
이 Squeeze Momentum Candle Painter는 고전적인 TTM 스퀴즈 논리를 기반으로 한 정교한 변동성 및 모멘텀 지표입니다. 화면을 오실레이터로 가득 채우는 대신, 이 도구는 가격 봉을 지능적으로 색칠하여 높은 확률의 폭발적 움직임과 추세 변화를 식별할 수 있게 하면서 메인 차트를 깔끔하고 전문적으로 유지합니다.
개요
시장은 두 가지 상태 사이를 전환합니다: 압축(스퀴즈)와 확장(변동성). 이 지표는 볼린저 밴드와 켈트너 채널 간의 관계를 사용하여 이러한 단계를 식별하며, 선형 회귀 모멘텀 알고리즘과 결합하여 추세 방향과 강도를 결정합니다.
주요 특징
-
- 직관적인 색상 코딩: 4가지 뚜렷한 캔들 색상을 통해 추세 모멘텀을 즉시 인식할 수 있습니다.
- TTM 스퀴즈 알고리즘: 가격 압축과 모멘텀 기울기를 내장 계산합니다.
- 깔끔한 UI 디자인: 별도의 히스토그램 창이 필요 없어 가격 움직임 분석을 위한 공간을 더 제공합니다.
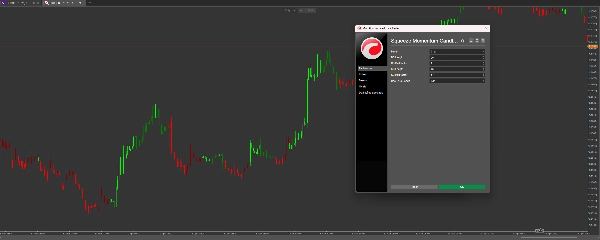
- 완전한 사용자 정의 가능: 볼린저 밴드와 켈트너 채널 매개변수를 조정하여 모든 시간대나 자산군(외환, 지수, 암호화폐)에 맞출 수 있습니다.
- 제로 래그 로직: 선형 회귀를 사용하여 전통적인 이동평균보다 모멘텀 변화를 더 빠르게 감지합니다.
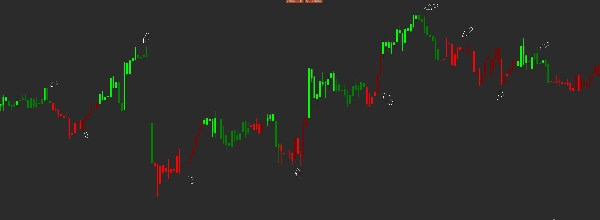
색상 읽는 법 :
-
- 라임 » 강한 상승 모멘텀 (증가 중)
- 그린 » 약해지는 상승 모멘텀 (감속 중)
- 레드 » 강한 하락 모멘텀 (증가 중)
- 마룬 » 약해지는 하락 모멘텀 (감속 중)
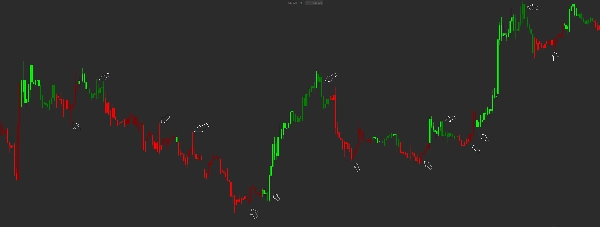
거래 전략
빌드업: 모멘텀이 낮을 때(마룬 또는 그린), 시장은 종종 "스퀴즈" 또는 통합 상태에 있습니다.
돌파: 그린에서 라임(강세) 또는 마룬에서 레드(약세)로 전환되는 것을 찾으세요. 이는 모멘텀이 가속화되고 있음을 나타냅니다.
종료: 라임 캔들이 그린으로 변하거나 레드 캔들이 마룬으로 변할 때, 현재 움직임이 힘을 잃고 있음을 신호합니다—이익 실현이나 손절매 조정에 완벽한 시기입니다.
이 지표를 선택해야 하는 이유?
대부분의 트레이더는 너무 늦게 반응해서 실패합니다. Squeeze Momentum Candle Painter는 시장의 "내부" 에너지를 시각화합니다. 캔들 색상이 변하는 것을 관찰함으로써 심리적 우위를 얻어, 승리하는 거래에 더 오래 머무르고 반전이 오기 전에 빠져나올 수 있습니다.
요약
고객 리뷰
5 | 100 % | |
4 | 0 % | |
3 | 0 % | |
2 | 0 % | |
1 | 0 % |


!["[Stellar Strategies] Inside Bar with Signals" 로고](https://cdn.ctrader.com/image/webp/1d9e8bfa-3b2c-4440-bb37-5856902008a7_30683)


