
Frac Support Resistance V1
Indikator
2 pembelian
Versi 1.0, Nov 2025
Windows, Mac
5.0
Ulasan: 1
Deskripsi
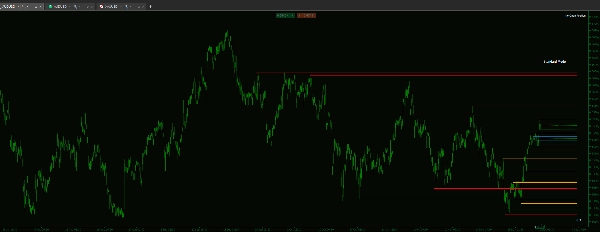
Jika Anda berdagang berdasarkan struktur pasar, Anda tahu level paling kritis sering ditetapkan pada timeframe yang lebih tinggi. Indikator khusus ini mengatasi frustrasi dalam mengidentifikasi dan melacak level tersebut secara manual.
Alat ini dirancang untuk memberikan hierarki visual yang dapat diandalkan, memastikan Anda dapat melihat batasan struktural kritis dan memprioritaskan zona bernilai tinggi tanpa meninggalkan layar eksekusi Anda.
Fitur Utama & Kontrol Granular
- Indikator ini dibangun untuk kinerja luar biasa dan visualisasi grafik yang bersih:
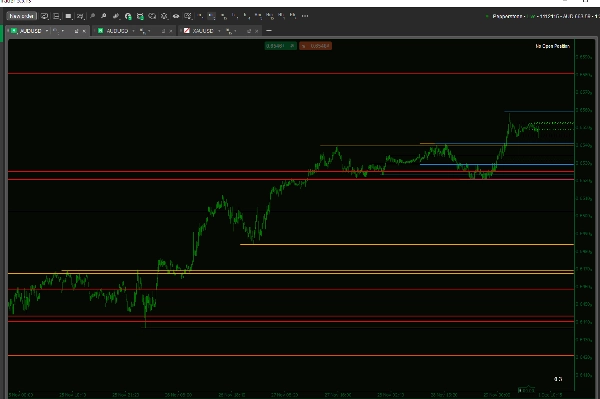
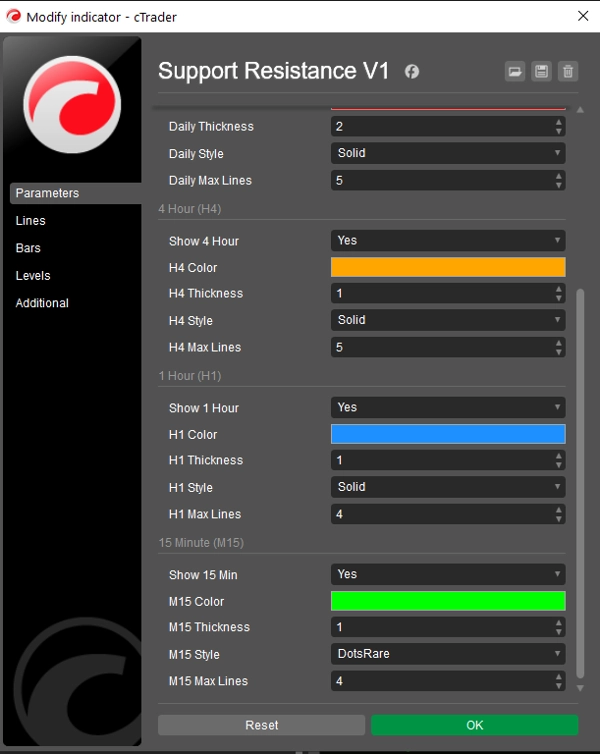
- Hierarki Visual Sejati: Dapatkan kontrol independen atas ketebalan, gaya garis (Solid, Dash, Dot), dan warna untuk setiap timeframe.
- Manfaat: Segera kenali kekuatan sebuah level hanya dari tampilannya (misalnya, atur garis D1 menjadi Tebal/Solid untuk struktur utama dan garis H1 menjadi Tipis/Berpoin untuk level langsung).
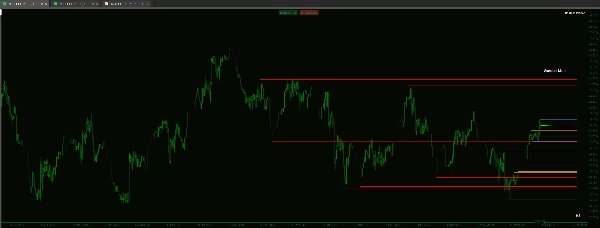
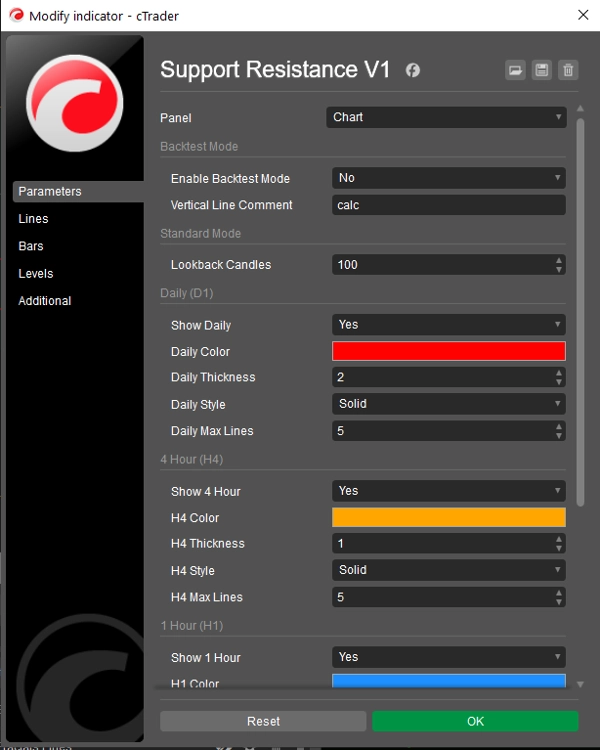
- Kontrol Kinerja & Fokus: Bosan dengan grafik yang berantakan? Anda dapat membatasi Jumlah Maksimum Garis yang ditampilkan untuk setiap timeframe secara individual.
- Contoh: Atur Maks Garis H4 menjadi 5 dan Maks Garis D1 menjadi 15 untuk memprioritaskan level terbaru pada timeframe yang lebih rendah sambil mempertahankan pandangan lebih dalam terhadap struktur utama.
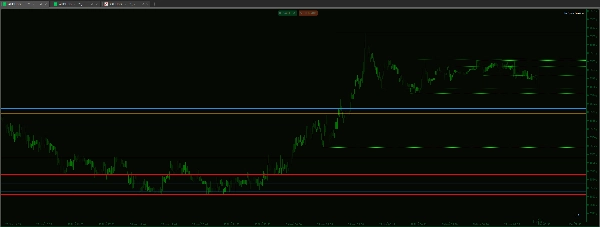
- Dasar Kode Bersih: Dibangun di atas logika fraktal yang dapat diandalkan, memastikan level yang diidentifikasi adalah pivot tinggi/rendah asli yang digunakan dalam analisis struktur standar.
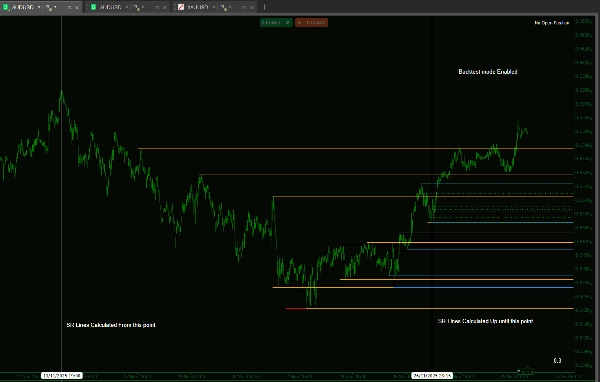
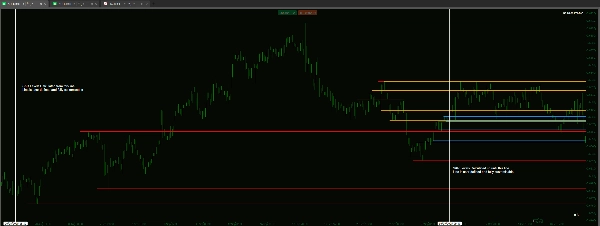
- Mode Backtesting Khusus: Termasuk fungsi untuk membatasi analisis indikator ke rentang waktu tertentu yang didefinisikan pada grafik. Ini penting untuk backtesting manual yang akurat dengan mensimulasikan kemajuan waktu tanpa bias masa depan.
Ringkasan
Ringkasan AI
Frac Support Resistance V1 is a technical indicator designed to automatically calculate and display smart support and resistance lines derived from multiple timeframes: daily (D1), 4-hour (H4), hourly (H1), and 15-minute (M15). It assists traders who rely on market structure by visually highlighting critical price levels established on higher timeframes, reducing the need for manual identification.
Key features include customizable visual hierarchy, allowing independent adjustment of line thickness, style (solid, dashed, dotted), and color for each timeframe. This enables quick recognition of the relative strength of support and resistance levels. Users can also control chart clarity by setting maximum numbers of lines per timeframe to prioritize recent or major structural levels.
The indicator is based on fractal logic to identify genuine high and low pivots consistent with standard market structure analysis. It includes a dedicated backtesting mode that restricts analysis to a specified historical period, facilitating unbiased manual strategy testing by simulating real-time progression.
Frac Support Resistance V1 supports various markets including Forex, cryptocurrencies, commodities, indices, and stocks, with tags indicating compatibility with symbols like BTCUSD, EURUSD, GBPUSD, XAUUSD, NAS100, and USDJPY. The tool is suited for strategies involving breakout, scalping, smart money concepts, and grid trading.
Profil indikator
Ulasan pelanggan
5.0
Ulasan: 1
5 | 100 % | |
4 | 0 % | |
3 | 0 % | |
2 | 0 % | |
1 | 0 % |
Ulasan pelanggan
December 1, 2025
A small account test feels safer, and the plan becomes easier to stick with, and the chart still needs a final look.
Diskusi
Pertanyaan umum
BTCUSD
Forex
Signal
Breakout
Indices
EURUSD
Commodities
GBPUSD
NZDUSD
Prop
Scalping
SMC
Crypto
Grid
Stocks
AI
XAUUSD
NAS100
USDJPY
Produk-produk yang tersedia melalui cTrader Store, termasuk bot trading, indikator, dan plugin, disediakan oleh pengembang pihak ketiga serta hanya ditujukan untuk akses teknis dan informasi. cTrader Store bukan broker dan tidak menyediakan saran investasi, rekomendasi pribadi, atau jaminan apa pun tentang kinerja di masa mendatang.


![Logo "Gaussian Channel [Iridio Capital]"](https://cdn.ctrader.com/image/webp/7c039209-5573-4a54-a072-f9528b503103_41960)


Harga
Sejak 14/01/2025
55
Penjualan
11.5K
Instal gratis