
Opis
VWAP (Volume Weighted Average Price) to wskaźnik handlowy, który oblicza średnią cenę aktywa skorygowaną o wolumen obrotu w określonym okresie. Jest szeroko stosowany przez day traderów, instytucje oraz systemy handlu algorytmicznego do oceny uczciwej wartości i optymalizacji realizacji transakcji.
Kluczowy wzór:
VWAP=∑(Price×Volume)/∑Volume
- Cena = Typowa cena (High + Low + Close) / 3 lub tylko cena zamknięcia.
- Wolumen = Wolumen obrotu dla każdego okresu.
2. Dlaczego używać VWAP?
Cel:
1)Odniesienie do uczciwej wartości
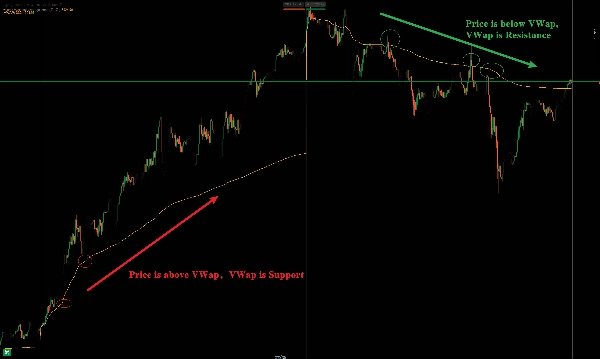
Cena > VWAP = nastawienie bycze; Cena < VWAP = nastawienie niedźwiedzie.
2)Dynamiczne wsparcie/opór
Pełni rolę kluczowego poziomu dla wybicia/odwrócenia w ciągu dnia.
3) Potwierdzenie trendu
Cena utrzymująca się powyżej VWAP = trend wzrostowy; poniżej = trend spadkowy.
Volume Weighted Average Price (VWAP) 指标详解及用法
1. 基本概念
VWAP(成交量加权平均价) 是一种技术分析工具,用于衡量资产在特定时间段内的平均交易价格,并根据成交量进行加权计算。它帮助交易者判断当前价格相对于市场的“公平价值”,常用于日内交易、算法交易和机构执行订单。
核心公式:
VWAP=∑(Price×Volume)/∑Volume
每条K线的价格 × 成交量累加,再除以总成交量,得到动态加权均价。
2. VWAP 的主要用途
用途:
1)判断市场公允价格
价格高于VWAP = 偏强;低于VWAP = 偏弱。
2)支撑/阻力参考
VWAP常作为短线交易的动态支撑/阻力位。
3)日内趋势确认
价格持续在VWAP上方 = 多头主导;下方 = 空头主导。
Podsumowanie
VWAP serves several key functions: it acts as a reference for fair value, where prices above VWAP indicate bullish bias and below indicate bearish bias; it provides dynamic support and resistance levels useful for intraday breakouts and reversals; and it helps confirm intraday trends, with prices sustained above VWAP signaling an uptrend and below signaling a downtrend.
This indicator supports various markets including forex, stocks, indices, commodities, and cryptocurrencies, making it a versatile tool for intraday market analysis and trading strategy development.


