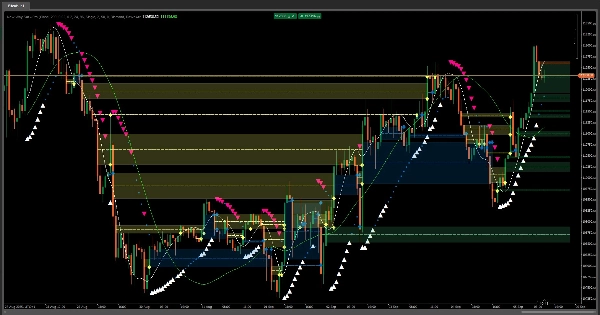
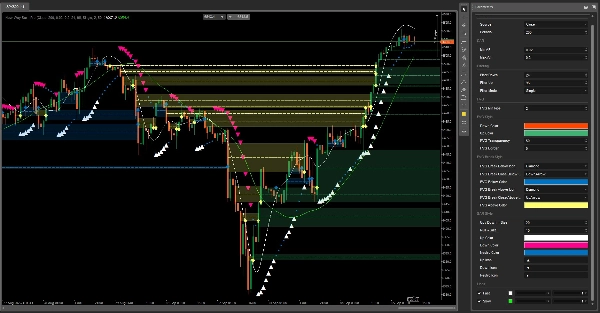
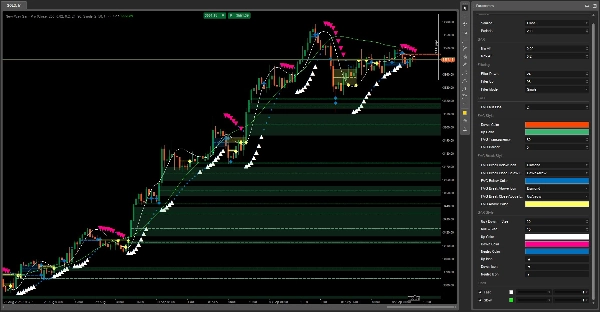
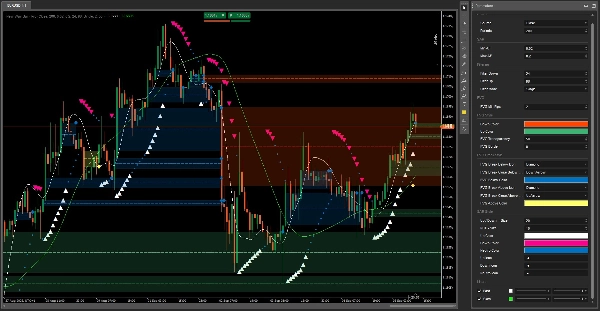
00
Days
:
00
Hours
:
00
Minutes
:
00
Seconds
New Way Sar - Pro
指标
2 购买
Version 1.0, Sep 2025
Windows, Mac
5.0
评价:1
"New Way Sar - Pro" 已上传图片"New Way Sar - Pro" 已上传图片"New Way Sar - Pro" 已上传图片"New Way Sar - Pro" 已上传图片
128
销售
10.15K
免费安装

The Parabolic SAR, or "Stop and Reverse," is a dynamic technical analysis tool that helps traders identify potential trend reversals and set trailing stop-loss orders. Unlike traditional indicators, the Parabolic SAR creates a series of dots that follow the price movement, adjusting as the trend gains momentum.

Our modern version offers a fresh, intuitive approach to this classic indicator. By combining powerful, reliable signals with a clean and modern design, it helps traders easily visualize trend direction and potential entry or exit points. By integrating key market levels like Fair Value Gaps, this version provides a comprehensive system for making more precise and confident trading decisions, giving you the clarity needed to navigate the markets with confidence.

5.0
评价:1
5
100 %
4
0 %
3
0 %
2
0 %
1
0 %
客户评价
October 8, 2025
Smooth and smart SAR! 🔄 Adapts to volatility, cuts false flips, and keeps your trades on trend. Perfect for swing and trend lovers who want cleaner signals without the noise."
Indices
Prop
Commodities
Stocks
Forex
Signal
Supertrend
Crypto
Scalping

该作者的其他作品

指标
VWAP
VWAP-Free
VWAP only timeframe
指标
NAS100
NZDUSD
XAUUSD
+10
MarketSession-MX
😎Read the description before purchasing💩
指标
Indices
Prop
Stocks
+3
4MA
This indicator consists of 3 moving averages that can be configured to your liking, from the type of moving average....
指标
Grid
NAS100
NZDUSD
+15
RangeBoxLevel
This technical analysis indicator provides information on market sentiment, trend and price levels....
cBot
Commodities
MACD
SparrowBot-FreeTrial-V2
This bot can automatically generate buy and sell orders based on three specific Fixed bugs.
指标
Stocks
Forex
MACD
MACDVolume
😎Read the description before purchasing💩
指标
Grid
NAS100
NZDUSD
+16
AllPattern
🔍 Discover All Candlestick Patterns… Absolutely Free!
指标
Grid
NAS100
NZDUSD
+15
RangeBoxFibonacci
With this Fibonacci retracement indicator, traders have full control over the retracement levels displayed on the chart.
指标
NAS100
NZDUSD
XAUUSD
+11
SessionOne
Session One is a tool for marking from to, useful if you've set the hours you want to trade
指标
Indices
RSI
Commodities
+1
OrderPrice-V3
A straightforward yet effective tool signals entry points for both buying and selling. Include 3 Moving Average
指标
Indices
Prop
Stocks
+5
New Way Sar - Free
The Parabolic SAR, or "Stop and Reverse," is a dynamic technical analysis tool.
指标
Indices
Prop
Breakout
+7
NTNPICLL
NTNPICLL is a tool to check the best trading hours for the assets and also includes the highest and lowest point

猜您喜欢

"HLC_Levels" 标识
全新
免费试用
$ 20
/
$25
指标
NAS100
Indices
XAUUSD
+6
HLC_Levels
The ultimate tool for Price Action and ICT. High, Low and Mid levels for days, weeks Inc. NY Midnight and Custom Range.
指标
Fibonacci
Anchored Moving Average
Anchor a moving average to any point on the chart and watch it extend dynamically as price evolves.
指标
Forex
LT_FairValueGap
Detects valid Fair Value Gaps from strong 3-bar patterns. Keep drawing unfilled gaps until price fills them.
指标
NAS100
RSI
NZDUSD
+15
RSI + EMA Crossover Signals
Dual confirmation RSI + EMA crossover signals with visual alerts and dynamic ATR offsets.
指标
Forex
Signal
MACD
swingh6
Swing-Trading Indicaotr for pairs like EUR/USD, AUD/USD, and USD/JPY. Most effective on higher time frames H4,H6,H12...
指标
RSI
Indices
ATR
+3
Divergency 1.1_withSourceCode
🔍 Divergence Indicator for cTrader (Update v1.1)
指标
ATR
Signal
Chandelier Flip Stop
An intelligent chandelier-style trailing stop that flips when price breaks the opposite stop.
指标
NAS100
NZDUSD
Martingale
+26
Market Cipher B
Market Cipher B
指标
RSI
Breakout
XAUUSD
+5
Prediction Based on Linreg & ATR
📊Predicts price movement by combining multi-timeframe trend analysis, market volatility 📉, and..
Repiptor RSI Amplified
RSI Amplified
指标
Breakout
Institutional Flow Radar
Institutional Flow Radar scans the chart for abnormal volume events and classifies them into two groups: Capital &Public
指标
NAS100
NZDUSD
Indices
+7
Hull Moving Average Colored
The traditional Hull Moving Average with different colours based on the slope (direction) of the trend.
128
销售
10.15K
免费安装