
Daily SD Levels - Indicator
Индикатор
4 покупки
Версия 1.0, Aug 2025
Windows, Mac
5.0
Отзывы: 1
Описание
Ежедневные уровни СД – динамические полосы стандартного отклонения на основе VWAP
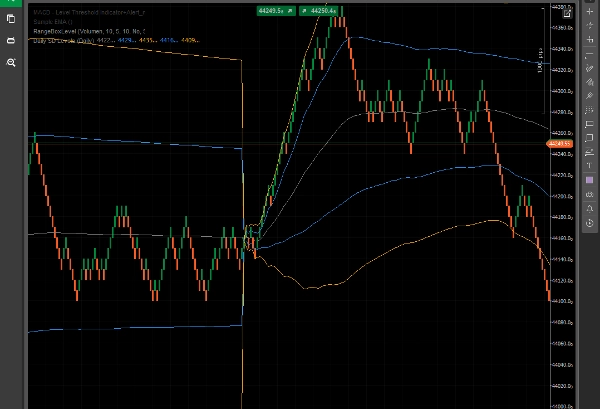
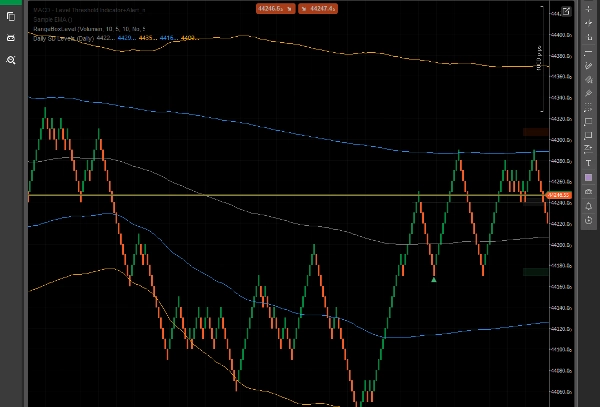
Индикатор Ежедневные уровни СД отображает динамический VWAP (объемно-взвешенную среднюю цену) и полосы стандартного отклонения (+1/+2 и -1/-2), рассчитанные за текущий торговый день.
Этот инструмент помогает трейдерам визуально оценивать внутридневную волатильность, потенциальные зоны поддержки/сопротивления и ценовые экстремумы, все основано на реальном объеме рынка и ценовом движении – а не на фиксированных или произвольных уровнях.
Основные характеристики:
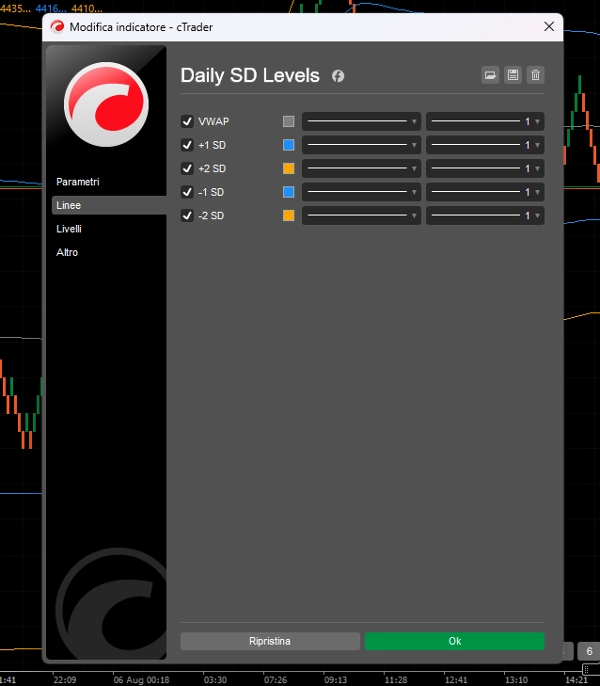
- Линия VWAP для отслеживания справедливой внутридневной цены.
- Полосы СД +1/+2 и -1/-2 для определения зон перекупленности/перепроданности.
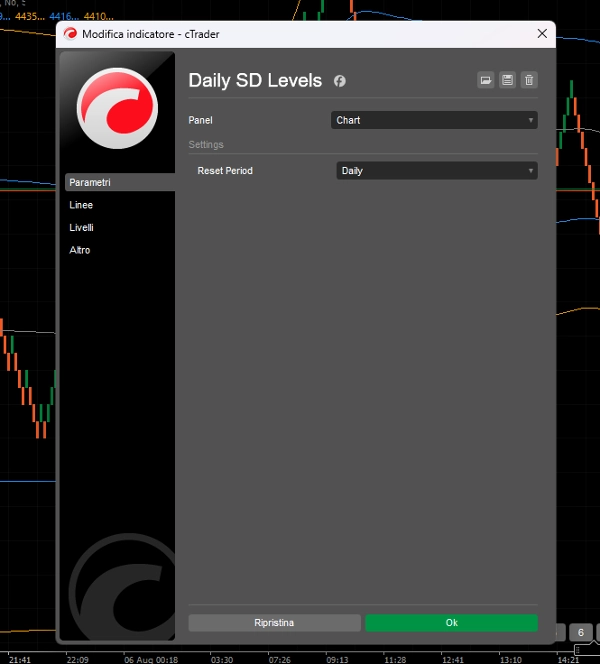
- Уровни сбрасываются ежедневно, адаптируясь к динамике цены и объема каждой сессии.
- Оптимизирован для Renko, Range Bar и внутридневной торговли.
- Создан для трейдеров, которым нужна четкость и динамические ценовые зоны.
Этот индикатор идеально подходит для:
- Настроек на возврат к среднему.
- Определения растянутых движений для возможных разворотов.
- Визуального подтверждения пробоев за статистические границы.
Никакой загроможденности. Только чистые, отзывчивые уровни, которые движутся вместе с рынком.
Сводка
Профиль индикатора
Отзывы покупателей
5.0
Отзывы: 1
5 | 100 % | |
4 | 0 % | |
3 | 0 % | |
2 | 0 % | |
1 | 0 % |
Отзывы покупателей
August 8, 2025
it gives context without making the decision, but the chart still needs a human read.
Обсуждение
Частые вопросы
Продукты, доступные в cTrader Store, включая торговых ботов, индикаторы и плагины, предоставляются сторонними разработчиками и доступны исключительно в информационных и технических целях. cTrader Store не является брокером и не предоставляет инвестиционные консультации, персональные рекомендации или какие-либо гарантии будущей доходности.


Цена
С 16/07/2025
5
Продажи