
Описание индикатора:
🎯 Индикатор RSI с уровнями Фибоначчи и скользящими средними Халла 🚀
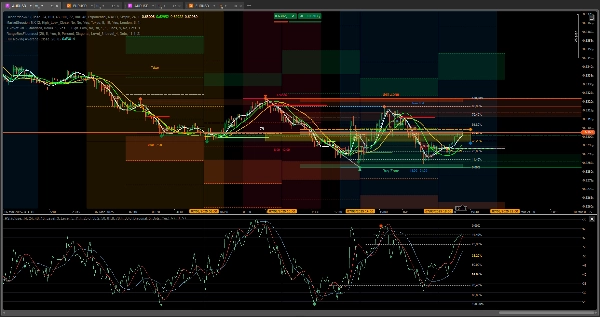
Хотите вывести свой технический анализ на новый уровень? Этот индикатор для вас! Он сочетает в себе лучшее из трёх мощных инструментов: RSI (Индекс относительной силы), уровни Фибоначчи и скользящие средние Халла, чтобы предоставить вам всесторонний и точный обзор рынка.
Основные характеристики:
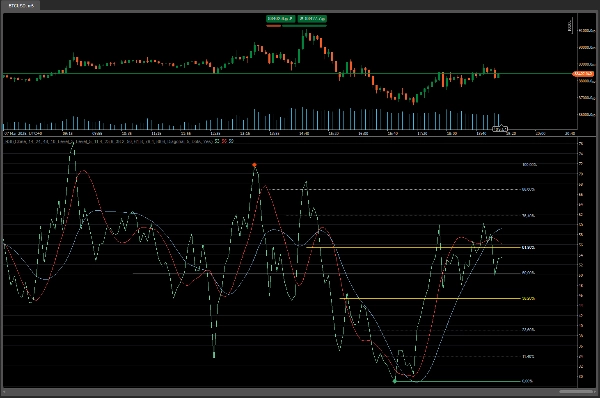
- RSI с уровнями Фибоначчи:
-
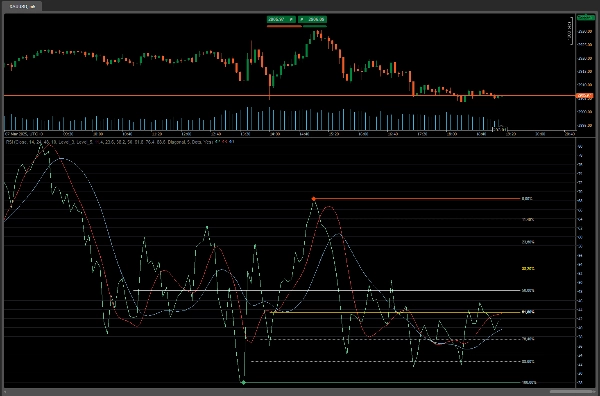
- Определяет ключевые зоны поддержки и сопротивления на основе уровней Фибоначчи.
- Помогает точнее выявлять потенциальные развороты и продолжения тренда.
- Скользящие средние Халла:
-
- Включает две скользящие средние Халла (Hull A и Hull B) для фильтрации рыночного шума и более эффективного выявления трендов.
- Обеспечивает чёткие сигналы входа и выхода на основе пересечений и изменений направления.
- Зоны изменения тренда:
-
- Выделяет критические области, где вероятны изменения тренда, помогая вам предвидеть значительные движения.
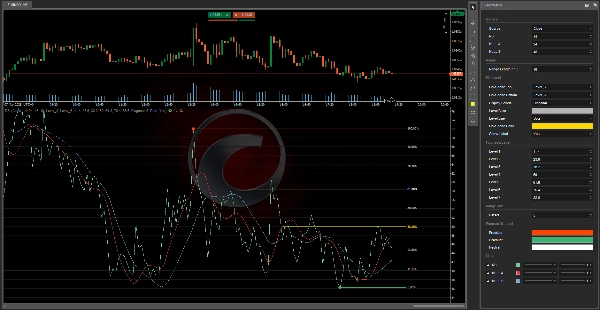
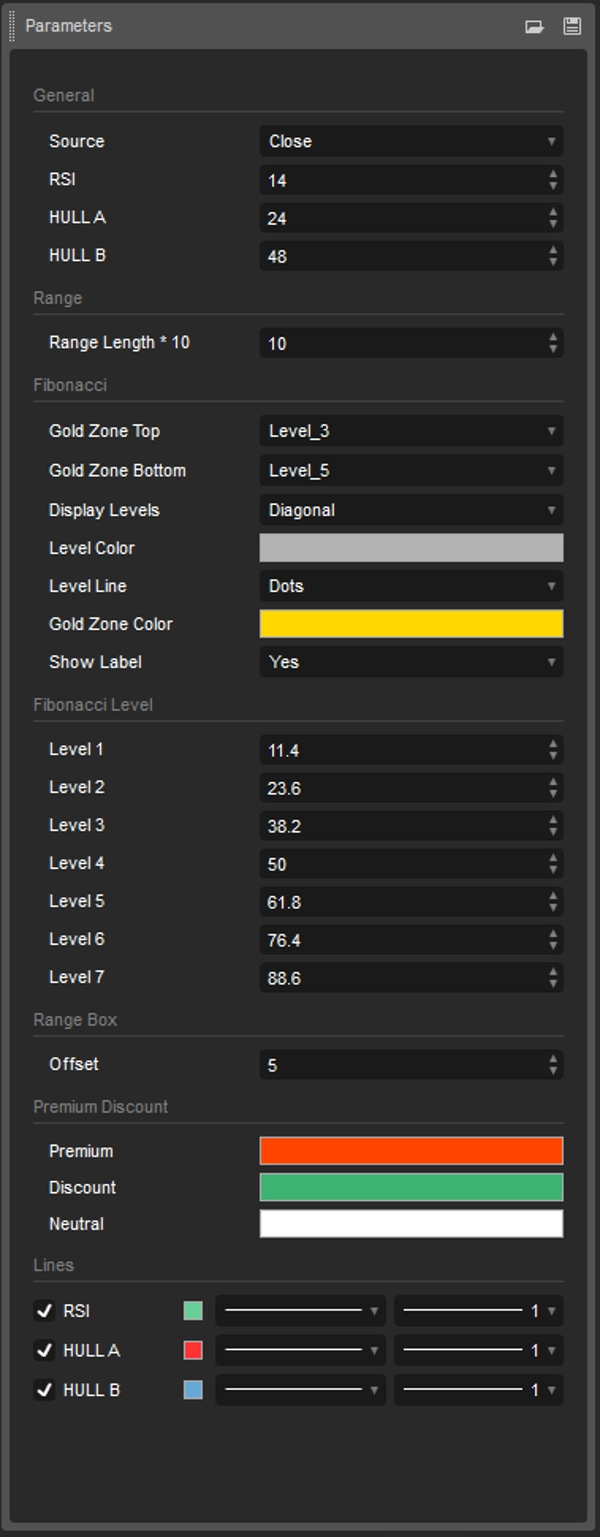
- Полная настройка:
-
- Настраивайте уровни Фибоначчи, цвета и стили линий по своему усмотрению.
- Конфигурируйте скользящие средние Халла под свою торговую стратегию.
- Чёткая визуализация:
-
- Чётко определённые иконки и трендовые линии для быстрого и лёгкого восприятия.
- Опциональные метки для отображения уровней Фибоначчи в процентах.
Преимущества для трейдеров:
- Более высокая точность: Сочетает RSI с уровнями Фибоначчи и скользящими средними Халла для более надёжных сигналов.
- Экономия времени: Нет необходимости накладывать несколько индикаторов; всё интегрировано в одном инструменте.
- Универсальность: Работает на любом таймфрейме и рынке (форекс, акции, криптовалюты и др.).
- Простота использования: Разработан для трейдеров всех уровней, от новичков до экспертов.
Почему стоит скачать этот индикатор?
- Инновационный: Уникальное сочетание классических и современных инструментов, которого вы не найдёте в других индикаторах.
- Эффективный: Помогает выявлять торговые возможности с большей ясностью и уверенностью.
Как использовать:
- Определите тренд: Используйте скользящие средние Халла для определения направления рынка.
- Ищите сигналы RSI: Проверьте, находится ли RSI в зоне перекупленности или перепроданности рядом с уровнями Фибоначчи.
- Подтвердите с помощью Фибоначчи: Используйте уровни Фибоначчи для определения ключевых зон поддержки и сопротивления.
- Принимайте обоснованные решения: Входите или выходите из сделок с большей уверенностью на основе чётких и точных сигналов.
Скачайте сейчас и улучшите свою торговлю!
Не тратьте больше времени на ручной анализ графиков. С этим индикатором у вас будет всё необходимое в одном месте. Сделайте свою торговлю более эффективной и прибыльной!
И с двумя инструментами вы можете перестать беспокоиться о том, что будет делать рынок, одним взглядом вы узнаете – покупать или продавать и переходить к другой задаче.
RangeBoxFibonacci: https://ctrader.com/products/526?u=VIZAINT
OrderPrice-V3: https://ctrader.com/products/397?u=VIZAINT
А для выбора
NTMPICLL https://ctrader.com/products/327?u=VIZAINT
MacdVolume https://ctrader.com/products/267?u=VIZAINT
MarketSession-MX: https://ctrader.com/products/525?u=VIZAINT
5 | 100 % | |
4 | 0 % | |
3 | 0 % | |
2 | 0 % | |
1 | 0 % |


