
TradingViewMACD
Indicateur
3 achats
Version 1.0, Feb 2025
Windows, Mac
5.0
Avis : 1

Description
Indicateur TradingViewMACD
Élevez votre stratégie de trading avec notre indicateur TradingViewMACD hautement personnalisable, conçu pour la plateforme cAlgo. Cet outil puissant combine la flexibilité et la précision nécessaires pour optimiser votre analyse de marché.
Caractéristiques principales :
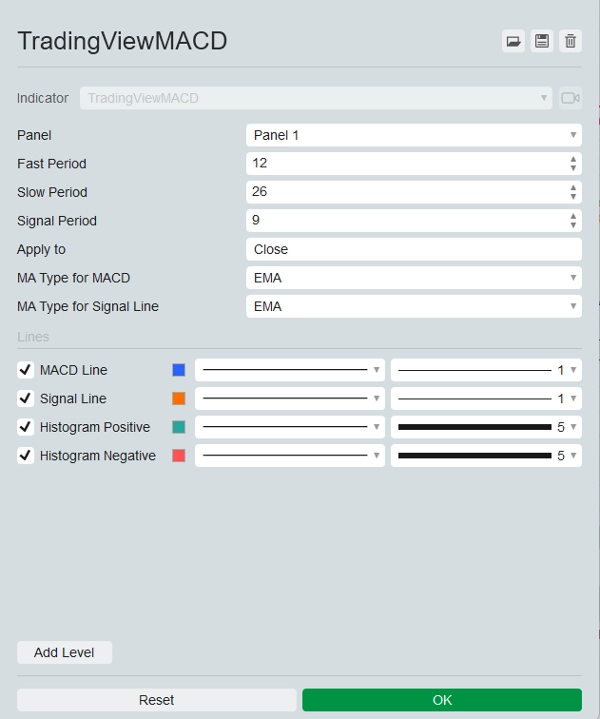
- Paramètres personnalisables :
-
- Période rapide : Ajustez la période de la moyenne mobile rapide selon votre style de trading.
- Période lente : Configurez la période de la moyenne mobile lente pour une meilleure précision des signaux.
- Période du signal : Définissez la période de la ligne de signal pour affiner vos points d'entrée et de sortie.
- Prix appliqué : Choisissez parmi les prix d'ouverture, haut, bas, clôture, médian, typique ou pondéré pour appliquer l'indicateur.
- Types multiples de moyennes mobiles :
-
- Sélectionnez entre la moyenne mobile simple (SMA) et la moyenne mobile exponentielle (EMA) pour la ligne MACD et la ligne de signal, offrant une flexibilité dans votre analyse.
- Sorties visuelles :
-
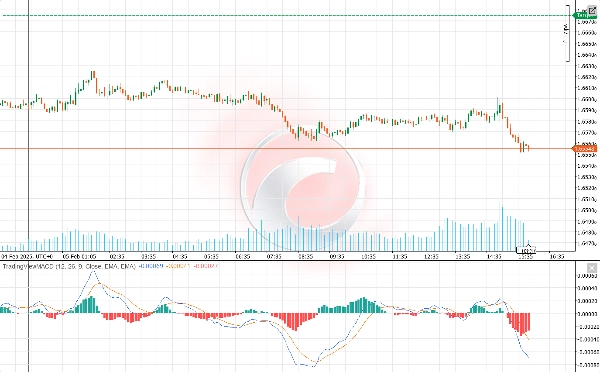
- Ligne MACD : Affichée en bleu vif pour une visibilité claire.
- Ligne de signal : Mise en évidence en orange vif pour la distinguer facilement de la ligne MACD.
- Histogramme : Différencie les valeurs positives et négatives avec des couleurs verte et rouge respectivement, offrant une représentation visuelle claire de la dynamique du marché.
- Informations améliorées sur le marché :
-
- L'indicateur calcule la différence entre les moyennes mobiles rapide et lente pour générer la ligne MACD.
- Calcule la ligne de signal comme la moyenne mobile de la ligne MACD.
- L'histogramme représente visuellement la différence entre la ligne MACD et la ligne de signal, vous aidant à identifier les signaux potentiels d'achat et de vente.
- Convivial :
-
- Facile à installer et à configurer, permettant aux traders de tous niveaux de bénéficier de ses fonctionnalités avancées.
- Documentation complète et support client pour garantir une expérience sans faille.
Libérez tout le potentiel de votre stratégie de trading avec l'indicateur TradingViewMACD. Améliorez votre analyse de marché, prenez des décisions éclairées et restez en avance grâce à cet outil de trading essentiel.
Résumé
Résumé IA
The TradingViewMACD indicator for the cAlgo platform is a customizable technical analysis tool designed to enhance market analysis. It calculates the difference between fast and slow moving averages to generate the MACD line, computes a signal line as the moving average of the MACD line, and displays a histogram representing the difference between these lines to help identify potential buy and sell signals.
Key features include adjustable parameters such as fast period, slow period, signal period, and applied price (open, high, low, close, median, typical, or weighted). Users can select between Simple Moving Average (SMA) and Exponential Moving Average (EMA) types for both the MACD and signal lines, providing analytical flexibility.
Visual outputs consist of a blue MACD line, an orange signal line, and a histogram with green and red colors indicating positive and negative momentum, respectively. The indicator is designed for ease of installation and configuration, supported by comprehensive documentation and customer support to accommodate traders of all experience levels.
Profil de l'indicateur
Avis clients
5.0
Avis : 1
5 | 100 % | |
4 | 0 % | |
3 | 0 % | |
2 | 0 % | |
1 | 0 % |
Avis clients
November 9, 2025
TradingView MACD brings the familiar feel straight to cTrader 🚀 - smooth, light, and 100% accurate to the original. Perfect for traders switching from TV who love clean momentum signals. Missing alerts, but flawless for classic trend and divergence play.
Discussion
Questions fréquentes
Signal
MACD
Les produits disponibles sur cTrader Store, notamment les bots de trading, les indicateurs et les plug-ins, sont fournis par des développeurs tiers et mis à disposition à titre informatif et à des fins d'accès technique uniquement. cTrader Store n'est pas un courtier et ne fournit aucun conseil en investissement, aucune recommandation personnelle ni aucune garantie quant aux performances futures.


![Logo de "[Hamster-Coder] Moving Average MTF"](https://cdn.ctrader.com/image/webp/b11b98b1-194d-4b8e-b00e-d611826ad159_31226)


Prix
Depuis le 22/11/2024
133
Ventes
2.58K
Installations gratuites