
Penerangan
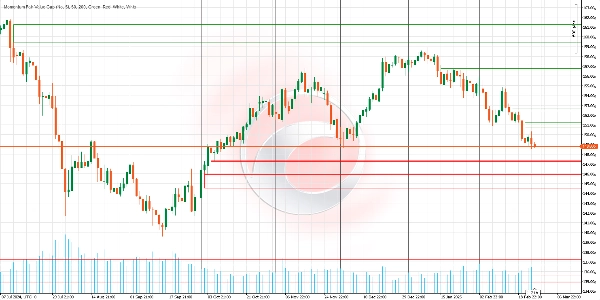
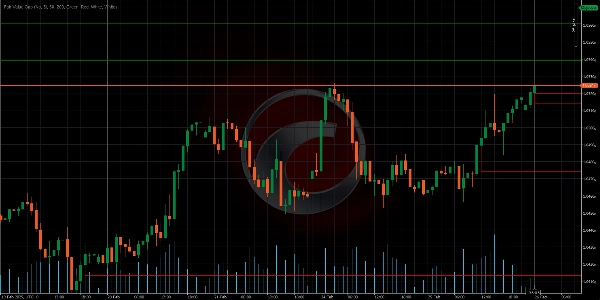
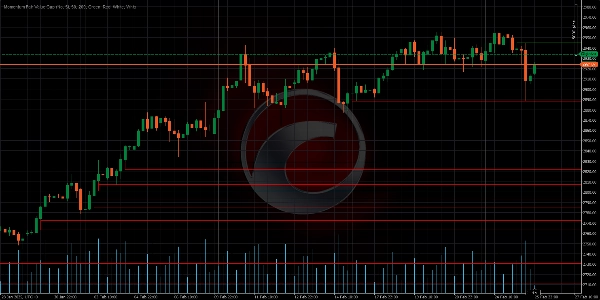
Ia mengenal pasti kawasan ketidakseimbangan pasaran (Jurang Nilai Adil atau FVG) dan memproyeksikannya pada carta dengan cara yang pintar. Berbeza dengan penunjuk lain, yang ini menyesuaikan diri secara masa nyata dengan tindakan harga, melaraskan saiz, ketahanan, dan kaitannya. Ia sesuai untuk pedagang yang mencari sasaran yang jelas dan pengurusan jurang visual yang maju.
✨ CIRI UTAMA
- Penyesuaian Jurang Dinamik
Logik: Jika harga menyentuh sebahagian FVG (contohnya, menyentuh sempadan bawah), penunjuk secara automatik mengubah saiz jurang untuk mencerminkan hanya kawasan yang tidak dilindungi.
Manfaat: Mengelakkan isyarat palsu dan mengekalkan hanya jurang dengan potensi sebenar yang aktif. - Isian Titik Tengah
Logik: Melukis garis di tengah jurang. Jika harga menyentuhnya, FVG dianggap "terisi" dan boleh dikeluarkan (boleh dikonfigurasikan).
Manfaat: Memerlukan hanya 50% sentuhan untuk mengesahkan penutupan, menapis bunyi dan perdagangan pramatang. - Projek Tidak Terhingga Sehingga Terisi
Logik: Jurang meluas ke masa depan tanpa had (ia tidak hilang selepas X lilin).
Manfaat: Memberi rujukan berterusan sehingga pasaran menyelesaikan ketidakseimbangan. - Pembersihan Automatik Jurang Tidak Sah
Logik: Secara automatik mengeluarkan jurang lama apabila ia telah terisi sepenuhnya.
Manfaat: Menjaga carta bersih dan fokus pada zon aktif. - Penyesuaian Visual Lanjutan
Pilihan: Warna berbeza untuk jurang bullish (hijau) dan bearish (merah). Pelarasan ketelusan untuk mengelakkan kekacauan carta.
Manfaat: Menyesuaikan dengan mana-mana gaya perdagangan atau strategi visual.
🎯 BAGAIMANA MENGGUNAKANNYA DALAM PERDAGANGAN?
Pengenalpastian Zon Utama:
- FVG Bullish (Hijau): Kawasan di mana pembeli kehilangan kekuatan sementara.
→ Strategi: Cari peluang membeli semasa penarikan balik ke zon ini. - FVG Bearish (Merah): Kawasan di mana penjual telah diatasi.
→ Strategi: Cari peluang menjual semasa kenaikan ke zon ini.
Interaksi dengan Harga:
- Jika jurang menyesuaikan secara dinamik (mengurangkan saiznya), ia menunjukkan pasaran sedang menguji zon tetapi tanpa pengesahan.
- Jika jurang dikeluarkan (oleh pengisian penuh atau Titik Tengah), anggap ketidakseimbangan telah diperbetulkan.
🔍 PENGESAHAN DENGAN ALAT LAIN
Gabungkan FVG dengan sokongan/rintangan, volum, atau RSI untuk menapis isyarat.
📋 PERBANDINGAN CIRI
___________________________________________________________________________________
Ciri Momentum Fair Value Gap Traditional Indicators
________________________________________________________________________________
Ketahanan---------------- Melanjutkan jurang sehingga terisi ----------------------- Hilang selepas X lilin
Ketepatan Penutupan-------- Pilihan pengesahan 50% --------------------- Memerlukan pengisian jurang penuh
Fleksibiliti ------------------ Menyesuaikan saiz dengan harga ------------------------- Tahap statik dan tidak berubah
Fokus Visual---------------- Mengeluarkan jurang yang tidak relevan ----------------------- Menyebabkan kekacauan carta dengan data lama
📝 CONTOH PRAKTIKAL
Senario dalam EURUSD (1H):
Satu FVG Bullish (hijau) terbentuk selepas lilin bearish yang ketara. Beberapa hari kemudian, harga berundur, menyentuh sempadan bawah jurang tetapi tidak mengisinya. Penunjuk secara automatik mengurangkan saiz jurang. Akhirnya, harga menyentuh Titik Tengah (garis tengah), mencetuskan pengeluarannya. Pedagang menjual selepas mengesahkan penolakan di zon tersebut.
Penunjuk Kedai Ctrader:
Struktur Pasaran Dinamik
Analisis Titik Pusing
Fibonacci Linear
Regresi Multi-masa
Bias Lilin Pelbagai Tahap
Penjejak
Garis Trend Sokongan dan
Rintangan Auto
Ringkasan
Key features include:
- Dynamic Gap Adjustment: Automatically resizes gaps when price partially touches them, reducing false signals.
- MidPoint Fill: Marks the gap centerline; if price touches it, the gap is considered filled and can be removed, requiring only 50% contact for confirmation.
- Infinite Projection: Gaps extend indefinitely until filled, maintaining persistent market imbalance references.
- Automatic Cleanup: Removes fully filled gaps to keep charts focused on active zones.
- Advanced Visual Customization: Uses distinct colors for bullish (green) and bearish (red) gaps with adjustable transparency.
In trading, bullish FVGs indicate zones where buyers lost strength, suggesting buying opportunities on pullbacks; bearish FVGs mark where sellers were overtaken, indicating selling opportunities on rallies. The indicator’s dynamic interaction with price helps confirm market imbalance resolution.
It is recommended to combine this indicator with other tools like support/resistance levels, volume, or RSI for signal filtering.
Ulasan pelanggan
5 | 0 % | |
4 | 100 % | |
3 | 0 % | |
2 | 0 % | |
1 | 0 % |


![Logo "Gaussian Channel [Iridio Capital]"](https://cdn.ctrader.com/image/webp/7c039209-5573-4a54-a072-f9528b503103_41960)


