
Support & Resistance Pro
지표
53 구매
버전 3.0, Jul 2026
Windows, Mac
5.0
리뷰: 1
설명
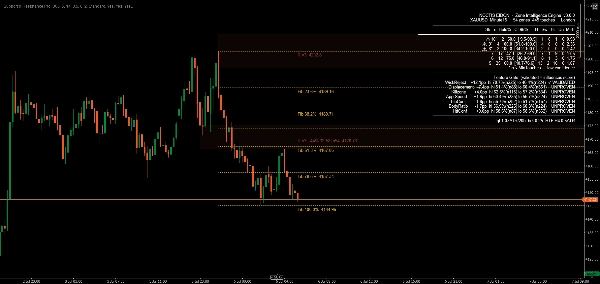
Support & Resistance Pro는 지지 및 저항 구역을 식별하며 — 대부분의 S/R 도구와 달리 — 가정이 아닌 실제 과거 데이터를 기반으로 구축된 독립적인 통계 엔진을 사용하여 해당 구역이 실제로 작동하는지 측정합니다. 각 구역은 나중에 깨져서 차트에서 사라진 구역을 포함한 완전한 과거 구역 집단에서 계산된 신뢰 구간과 함께 유지율 통계를 보여줍니다. 이 범주의 대부분 지표는 오늘날에도 여전히 보이는 수준만 계산하여 모든 강도 주장을 조용히 부풀립니다. 이 도구는 그렇지 않습니다.
주요 기능
- 통계적으로 검증된 구역 각 구역은 가정된 강도 점수가 아닌 95% 신뢰 구간을 가진 실제 역사적으로 측정된 유지율을 가집니다 — 하나의 신호인 접촉 지점에서의 윅 거부는 공식적으로 검증되었습니다: EURUSD와 비트코인에서 여러 시간대에 걸쳐 확인되었으며, 실제 샘플 외 테스트에서 보이지 않는 데이터에서도 효과가 유지되었습니다.
- 자동 역할 전환 깨진 지지는 자동으로 저항이 되고 그 반대도 마찬가지이며, 뚜렷한 시각적 표시기가 있습니다 — 지표는 구역이 가격의 어느 쪽에 위치하는지 추적하고 원래 형성된 방식에 고정된 색상이 아닌 그에 따라 색상을 지정합니다.
- 상위 시간대 일치 차트의 구역은 선택한 상위 시간대와 비교되며, 일치하는 HTF 구조가 별도의 시각적 오버레이로 차트에 직접 그려집니다.
- 피보나치 되돌림 통합 가장 최근 스윙에서 자동으로 생성된 피보나치 되돌림 수준으로, 각각 비율과 브로커의 고유 정밀도로 정확한 가격이 표시되며, 인접 구역과 자동으로 중복되지 않도록 정리되어 라벨이 겹치지 않습니다.
- 포화 경고 너무 많이 테스트된 구역은 더 강하다고 가정하지 않고 표시됩니다 — 우리의 데이터는 많이 테스트된 구역이 더 나쁘게 작동하는 경향이 있음을 보여주며, 이는 해당 구역의 대기 유동성이 이미 소진되었기 때문일 가능성이 큽니다.
- 개방형 검증 게이트 몸통 비율, 접근 속도, 세션/킬존 타이밍, 변위 테스트 등 여섯 가지 추가 후보 신호가 내장 통계 패널에 실시간으로 표시되며 각각의 유지율 판독값을 가집니다. 이들은 각각 윅 거부가 통과한 동일한 증거 기준을 독립적으로 통과할 때까지 점수나 순위에 영향을 미치지 않습니다. 무엇이 증명되었고 무엇이 증명되지 않았는지 정확히 볼 수 있습니다.
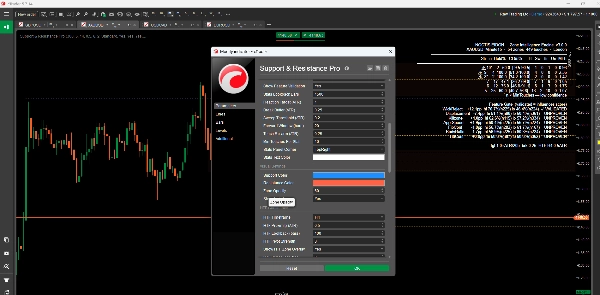
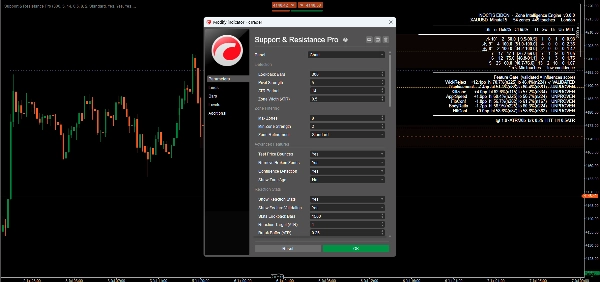
- 사용자 정의 설정 감지 민감도, 구역 필터링, 시각적 스타일링, 알림 동작에 대한 광범위한 매개변수 제어.
- 실시간 알림 구역 터치, 돌파, 일치 이벤트에 대해 구성 가능한 팝업, 이메일, 사운드 알림을 제공하며, 채널별로 독립적으로 토글할 수 있습니다.
장점
- 가정이 아닌 증거: 차트의 모든 통계는 독립적으로 확인할 수 있으며 — 지표는 자체 샘플 내/샘플 외 검증 도구를 포함합니다
- 생존 편향 없음: 강도 주장은 단지 살아남은 수준뿐 아니라 완전한 과거 구역 집단에 기반합니다
- 정직한 공개: 증명된 신호와 증명되지 않은 신호가 차트에 항상 해당 상태로 표시됩니다
적합 대상
단순한 선이 아닌 수준 뒤에 있는 통계적 증거를 보고자 하는 트레이더 — 외환, 암호화폐 및 기타 상품에서 엄격하게 측정된 지지 및 저항 접근법을 찾는 데이 트레이더, 스윙 트레이더, 체계적 트레이더.
결론
Support & Resistance Pro는 한 가지 원칙을 중심으로 구축되었습니다: 강도 주장은 측정될 때까지 진짜가 아닙니다. 하나의 신호가 교차 상품, 교차 시간대, 샘플 외 확인을 통해 그 기준을 통과했습니다. 나머지는 여전히 테스트 중임을 정직하게 보여줍니다 — 검증할 수 없는 숫자는 전혀 보여줄 가치가 없기 때문입니다.
요약
AI 요약
Support & Resistance Pro is an advanced trading indicator designed to identify critical support and resistance levels in financial markets. It uses advanced algorithms and historical price data to enhance technical analysis and support informed trading decisions. Key features include:
- Dynamic support and resistance levels that adjust in real-time based on recent price action.
- Multi-timeframe analysis to view levels across different timeframes for a comprehensive market overview.
- Calculation and display of pivot points to mark potential intraday reversal zones and target prices.
- Highlighting of psychological price levels (round numbers) to gauge market sentiment.
- Integration of Fibonacci retracement levels to assist in identifying support and resistance during price corrections.
- Customizable settings for lookback periods, visualization styles, and color schemes to suit individual trading preferences.
- Clear graphical representation for easy identification of market conditions.
- Configurable real-time alerts when prices approach critical levels.
This indicator supports various trading styles including scalping, day trading, and swing trading, and is suitable for traders in forex, commodities, stocks, and indices markets. It is intended for both beginner and experienced traders seeking structured market analysis and enhanced decision-making through reliable support and resistance data.
지표 프로필
지표 카테고리
지지 및 저항
출력 유형
시각화
신호
데이터 요구 사항
막대만
지원되는 신호
돌파
반전
레벨 터치
레벨 돌파
고객 리뷰
5.0
리뷰: 1
5 | 100 % | |
4 | 0 % | |
3 | 0 % | |
2 | 0 % | |
1 | 0 % |
고객 리뷰
November 8, 2025
A clean, reliable S/R mapper ⚡. Support & Resistance Pro marks key zones with clarity and speed - perfect for Price Action fans who need structure, not clutter. No alerts or price labels yet, but for spotting reaction levels and planning entries, it’s a solid chart companion.
상담
자주 묻는 질문(FAQ)
Fibonacci
Forex
Breakout
Scalping
GBPUSD
트레이딩 봇, 지표, 플러그인 등 cTrader Store에서 제공되는 상품은 제3자 개발자에 의해 제공되며, 이는 단순히 정보 및 기술적 접근을 목적으로 제공된 것입니다. cTrader Store는 중개인이 아니며, 투자 조언, 개인별 추천 또는 향후 성과에 대한 어떠한 보장도 제공하지 않습니다.


!["[Hamster-Coder] Moving Average MTF" 로고](https://cdn.ctrader.com/image/webp/b11b98b1-194d-4b8e-b00e-d611826ad159_31226)


가격
가입일 22/11/2024
133
판매
2.57K
무료 설치