
설명
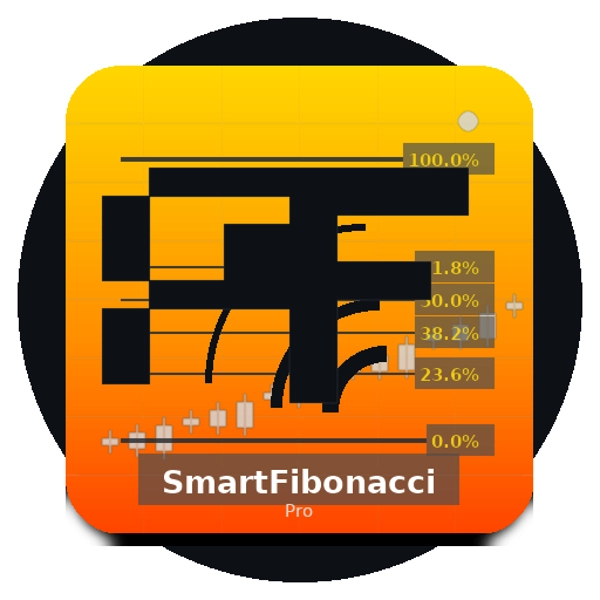
SmartFibonacci — 자동화되고 구성 가능한 피보나치 되돌림 및 확장 기능으로 상위 타임프레임 지원, 가격 라벨 및 근접 알림을 제공하여 더 빠르고 자신감 있는 거래 결정을 돕습니다.
스토어용 간단 설명 (1~2줄)
SmartFibonacci는 자동으로 스윙 고점/저점을 감지하고 차트에 명확한 피보나치 되돌림과 선택적 확장선을 그립니다. 구성 가능한 조회 기간, 상위 타임프레임 스윙 감지, 가격/퍼센트 라벨 및 근접 알림 기능으로 당일 스캘핑과 스윙 설정 모두에 이상적입니다.
전체 제품 설명 (cTrader 스토어용 복사-붙여넣기 준비 완료)
SmartFibonacci는 가볍고 성능에 중점을 둔 cTrader 지표로, 피보나치 분석을 자동화하여 레벨 그리기에 소요되는 시간을 줄이고 거래에 더 집중할 수 있게 합니다. 구성 가능한 조회 기간 내에서 가장 최근의 스윙 고점과 저점을 찾아 되돌림 레벨과 선택적 투영(확장) 레벨을 그리고, 빠른 해석을 위해 가격 및 퍼센트 라벨을 표시합니다. 강력한 신호를 위해 SmartFibonacci는 상위 타임프레임에서 스윙 포인트를 계산하면서 현재 차트에 레벨을 렌더링할 수 있습니다. 내장된 알림(팝업 + 사운드)은 가격이 보이는 피보나치 레벨의 구성 가능한 핍 거리 내에 들어올 때 알려줍니다.
이 목록에는 주요 UI 요소를 보여주는 명확한 스크린샷, 예제 워크플로우, 구성 설정 및 샘플 출력(가격 라벨, 확장, 알림)이 포함되어 있어 구매자가 구매 전 기능과 사용자 경험을 쉽게 평가할 수 있습니다.
주요 기능
- 자동 스윙 감지 — 구성 가능한 조회 기간 내에서 가장 최근의 스윙 고점/저점을 찾습니다.
- 상위 타임프레임 스윙 옵션 — 더 부드럽고 의미 있는 레벨을 위해 상위 타임프레임에서 스윙 피벗을 계산합니다.
- 되돌림 및 확장 — 표준 되돌림 선과 선택적 투영(확장) 레벨(사용자 정의 가능한 퍼센트 예: 127.2, 161.8 등)을 그립니다.
- 가격 및 퍼센트 라벨 — 각 보이는 레벨은 빠른 의사결정을 위해 퍼센트와 정확한 가격을 표시합니다.
- 사용자 정의 가능한 시각 요소 — 되돌림/확장 색상, 선 두께 및 선 스타일을 설정할 수 있습니다.
- 근접 알림 — 가격이 보이는 피보나치 레벨의 구성 가능한 핍 반경 내에 들어올 때 팝업 + 사운드 알림; 가장 가까운 레벨만 알림 옵션 포함.
- 효율적인 재그리기 로직 — 스윙 피벗이 변경될 때만 지표를 재그려 차트 혼잡과 CPU 사용량을 줄입니다.
- 안전한 기본값 — 설치 후 즉시 사용 가능한 합리적인 기본 설정.
- cTrader / cAlgo 호환 — 오버레이 지표로 실행되도록 설계됨.
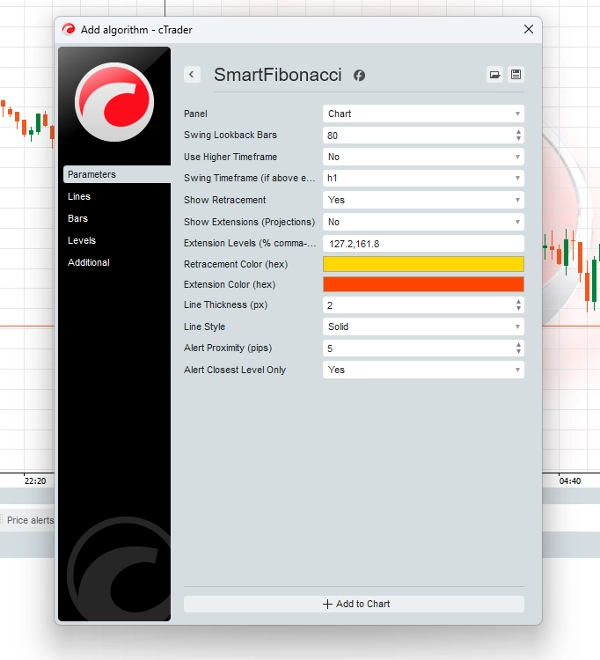
구성 (매개변수 및 설명)
- 스윙 조회 바 (int) — 스윙 고점/저점을 찾기 위해 얼마나 많은 바를 거슬러 올라갈지 설정 (기본값 80).
- 상위 타임프레임 사용 (bool) — 현재 차트에 그리면서 상위 TF에서 감지 활성화.
- 스윙 타임프레임 (TimeFrame) —
Use Higher Timeframe가 활성화되었을 때 사용할 상위 타임프레임. - 되돌림 표시 (bool) — 되돌림 레벨 그리기 토글.
- 확장 표시 (bool) — 확장/투영 레벨 그리기 토글.
- 확장 레벨 (string) — 쉼표로 구분된 퍼센트 값 (예:
127.2,161.8)로 투영선을 채움. - 되돌림 색상 / 확장 색상 (hex) — 되돌림 및 확장 선 색상 선택.
- 선 두께 (px) — 정수형 선 두께 설정.
- 선 스타일 (enum) — 실선, 점선 등 선택.
- 알림 근접 거리 (핍) — 근접 알림을 위한 핍 단위 거리.
- 가장 가까운 레벨만 알림 (bool) — 활성화 시 가장 가까운 피보나치 레벨만 팝업을 트리거합니다.
분석 출력 및 사용자 경험 요소
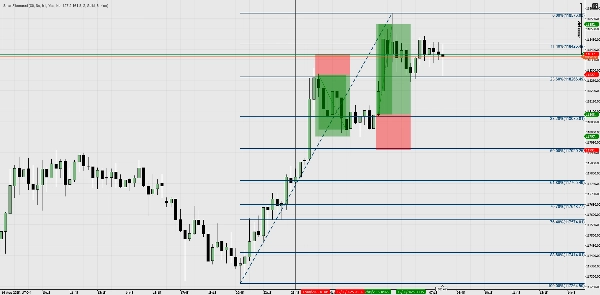
- 차트 내 선 — 명확한 퍼센트 라벨(예: 61.8%)과 가격 라벨(예: 1.23456)이 있는 되돌림 및 확장 선.
- 팝업 알림 — 가격이
Alert Proximity영역에 들어올 때 사용자에게 화면 팝업과 시스템 사운드 알림 제공. - 비침해적 재그리기 — 감지된 스윙이 변경될 때만 업데이트하여 잦은 깜박임 방지.
- 가격 소스 일관성 — 알림과 라벨은 피보나치가 그려진 동일한 Bars 시리즈를 사용해 계산됨(상위 타임프레임 계산 시 중요).
예제 워크플로우 / 사용 시나리오
- 빠른 설정 (스캘핑 / 당일 거래)
-
- SmartFibonacci를 5분 차트에 연결하고
Lookback = 80,ShowRetrace = true로 설정합니다. - 되돌림 레벨을 관찰하고 61.8% / 50%를 당일 반응 구역으로 사용합니다.
- 중요한 레벨에 가격이 접근할 때 알림을 받으려면
Alert Proximity = 5 pips를 활성화합니다.
- SmartFibonacci를 5분 차트에 연결하고
- 상위 타임프레임 컨텍스트 (스윙 트레이딩)
-
-
Use Higher Timeframe = true로 설정하고Higher Timeframe = H4(또는 Daily)를 선택합니다. - 레벨은 H1 또는 M30에서 거래하는 동안 H4 스윙을 반영하여 상위 TF 구조와 더 잘 일치합니다.
- 확장선(127.2, 161.8)을 스윙 거래의 이익 목표로 사용합니다.
-
- 검증 및 합류
-
- SmartFibonacci 레벨을 기존의 지지/저항, 구조 붕괴 또는 이동 평균과 결합하여 진입을 검증합니다.
- 팝업 알림을 사용하여 진입 타이밍을 맞추거나 상호작용을 기록하여 백테스트에 활용합니다.
- 알림 기반 워크플로우
-
- 여러 차트를 모니터링하는 동안 지표를 켜두고, 가격이 구성된 보이는 피보나치 레벨에 가까워질 때 팝업을 받아 적절히 대응합니다.
요약
고객 리뷰
5 | 100 % | |
4 | 0 % | |
3 | 0 % | |
2 | 0 % | |
1 | 0 % |


