
CandleColourFlow_MultiFx
지표
2 구매
버전 1.0, Jul 2025
Windows, Mac
4.0
리뷰: 2
설명
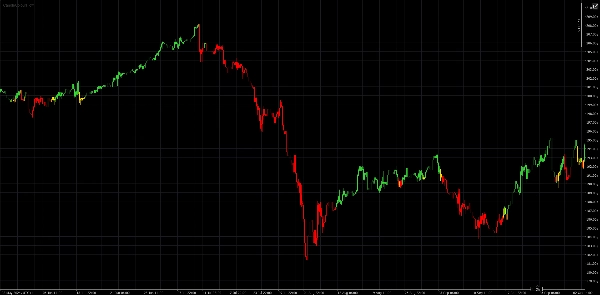
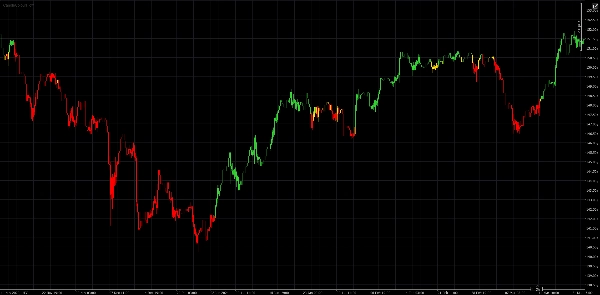
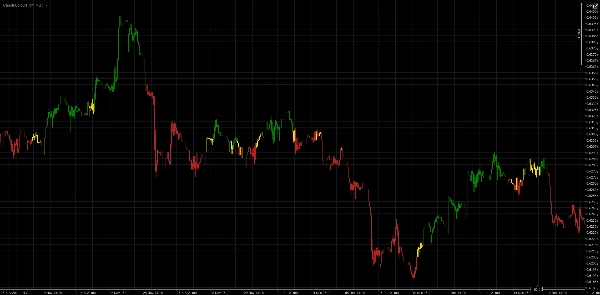
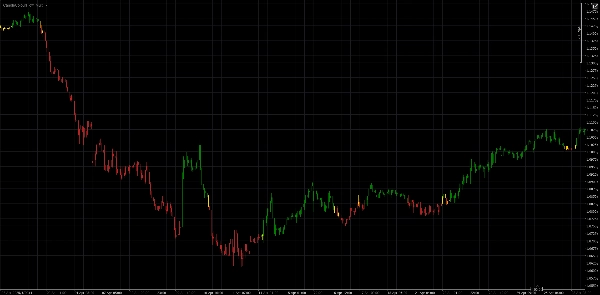
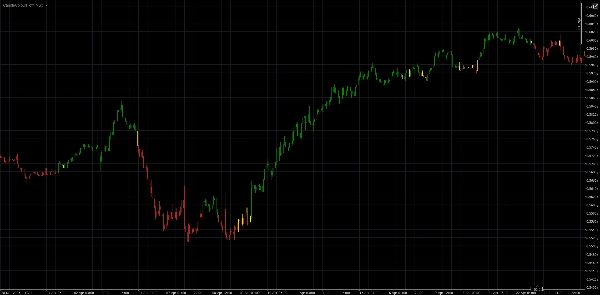
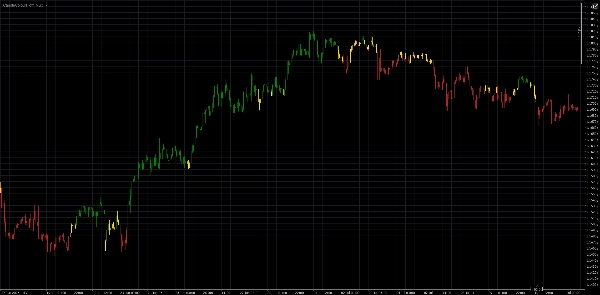
CandleColourFlow는 외환 시장에서 추세와 시장 전환점을 명확하고 빠르게 식별하도록 설계된 혁신적인 지표입니다. 간단하고 직관적인 색상 시스템 덕분에 초보 트레이더도 더 정보에 기반한 거래 결정을 내릴 수 있습니다.
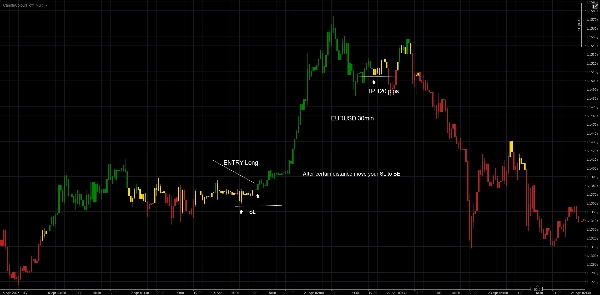
🔹 녹색 캔들 – 롱 포지션 개설에 유리한 조건을 제시합니다
🔹 빨간 캔들 – 잠재적인 숏 거래 기회를 제시합니다
🔹 금색 캔들 – 시장의 불확실성을 신호합니다: 잠재적 통합 또는 추세 지속
💡 CandleColourFlow의 독특한 점은 무엇인가요?
- 여러 지표 없이도 시장 상황을 명확하게 시각적으로 파악할 수 있습니다
- 모멘텀 변화와 가격 구조 변화를 자동으로 감지합니다
- 전체 시장 상태를 빠르게 평가하는 데 완벽합니다
- 모든 타임프레임에서 작동하지만 제 의견으로는 1시간 이상이 가장 좋으며, 모두 개인 취향에 따라 다릅니다
⚠️ 법적 고지:
이 지표는 교육 목적으로만 사용됩니다. 투자 조언이나 금융 거래 실행 권고를 구성하지 않습니다.
더 많은 것을 찾고 계신가요?
CandleColourFlow의 추가 버전이 곧 출시될 예정이며, 각각 고유한 기능과 더 넓은 시장 지원을 제공합니다.
요약
AI 요약
CandleColourFlow_MultiFx is a Forex market indicator designed to identify trends and potential turning points using a straightforward color-coded system. It displays green candles to indicate favorable conditions for long positions, red candles to suggest potential short trade opportunities, and gold candles to signal market indecision, such as consolidation or possible trend continuation. The indicator provides clear visual insights into market conditions without requiring multiple tools, automatically detects momentum shifts and changes in price structure, and facilitates quick assessment of overall market state. It is optimized for use on Forex majors, minors, and crosses, and functions across all timeframes, with a preference for 1-hour and higher intervals. This tool is intended for educational purposes and does not constitute investment advice.
지표 프로필
고객 리뷰
4.0
리뷰: 2
5 | 0 % | |
4 | 100 % | |
3 | 0 % | |
2 | 0 % | |
1 | 0 % |
고객 리뷰
July 25, 2025
상담
자주 묻는 질문(FAQ)
트레이딩 봇, 지표, 플러그인 등 cTrader Store에서 제공되는 상품은 제3자 개발자에 의해 제공되며, 이는 단순히 정보 및 기술적 접근을 목적으로 제공된 것입니다. cTrader Store는 중개인이 아니며, 투자 조언, 개인별 추천 또는 향후 성과에 대한 어떠한 보장도 제공하지 않습니다.
이 작성자의 상품 더 보기


!["High-Low Divergence [Iridio Capital]" 로고](https://cdn.ctrader.com/image/webp/443c4661-7abb-40f1-842f-4b6ec560649b_40914)


가격
가입일 25/02/2025
2
판매
265
무료 설치