
LT_Ind_Candles
Indicatore
4 acquisti
Versione 1.0, Sep 2024
Windows, Mac
4.0
Recensioni: 1
Descrizione
Nota: Testato solo su cTrader Windows.
Pattern a singola candela:
- Doji
- Martello
- Shooting Star
Pattern a 2 candele:
- Engulf
- DarkCloud
- Piercing
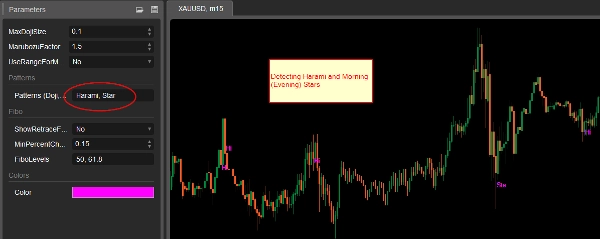
- Harami
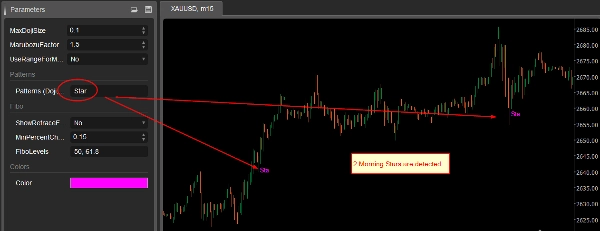
Pattern a 3 candele:
- Morning Stars
- Eveving Stars
Marubozu:
Se selezionato, la dimensione delle candele con corpo grande viene annotata. Leggi le descrizioni delle impostazioni per la dimensione.
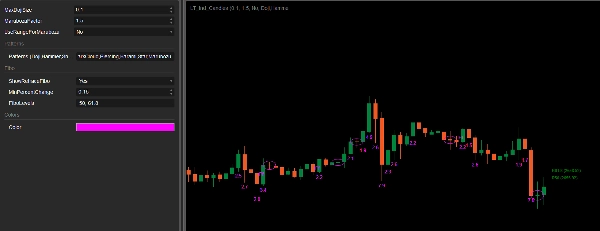
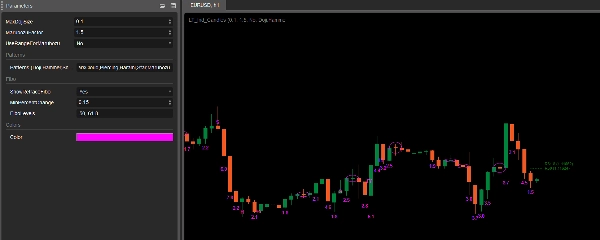
Impostazioni:
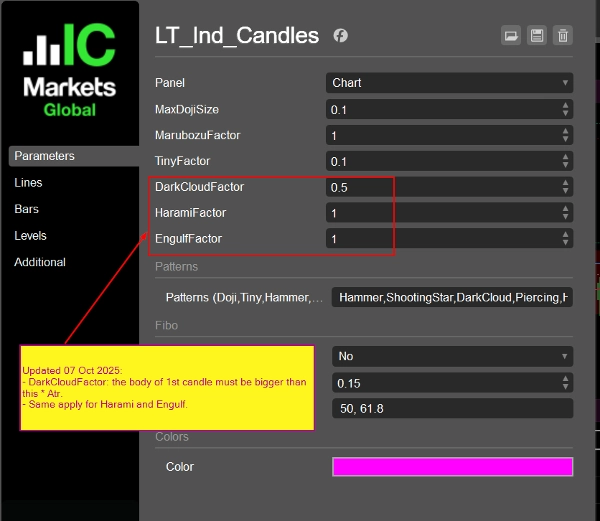
(Aggiornato 07 Ott 2025:
- Usa Atr (14 periodi, media mobile semplice) invece di MedianBarBody
- Aggiunte impostazioni per DarkCloud (e Piercing), Harami, fattori Engulf
)
- MaxDojiSize: Il rapporto massimo tra il corpo della barra e l'intervallo della barra per considerare un Doji (default 0.1).
- Fattore Marubozu: Il corpo della barra corrente deve essere > MarubozuFactor * Atr per essere considerata una candela grande (Marubozu). Qui non ci interessa lo stoppino.
- Usa intervallo per Marubozu: Usa BarRange (High - Low) invece di BarBody (Open - Close).MathAbs() quando si verifica Marubozu.
- Pattern: inserisci i pattern che vuoi rilevare, separati da virgola. I valori accettati sono: Doji,Hammer,ShootingStar,Engulf,DarkCloud,Piercing,Harami,Star,Marubozu. Nota che se scegli "Star", verranno rilevati sia Morning Stars che Evening Stars.
- Mostra Retrace Fibo: Un livello Fibo di aiuto per controllare il rischio. Quando ci sono 2 candele consecutive con Higher High e Higher Low, vengono tracciati i livelli Fibo specificati calcolati da quelle 2 candele. Puoi mantenere la tua entrata fino a quando il prezzo raggiunge i livelli per controllare il rischio. I livelli sono impostabili. Il lato opposto è lo stesso (Lower High e Lower Low).
- Min Percent Change: Le 2 candele usate per i livelli Fibo devono formare un cambiamento di prezzo > questa percentuale.
- Livelli Fibo: inserisci i tuoi livelli separati da virgola.
- Colore: colore dell'annotazione della candela.
Riepilogo
Profilo indicatore
Recensioni dei clienti
4.0
Recensioni: 1
5 | 0 % | |
4 | 100 % | |
3 | 0 % | |
2 | 0 % | |
1 | 0 % |
Discussioni
Domande frequenti
Forex
Signal
Indices
Commodities
Crypto
Stocks
ATR
I prodotti disponibili tramite cTrader Store, inclusi bot di trading, indicatori e plugin, sono forniti da sviluppatori terzi e resi disponibili esclusivamente a scopo informativo e di accesso tecnico. cTrader Store non è un broker e non fornisce consulenze in materia di investimento, raccomandazioni individualizzate o garanzie di risultati futuri.


Prezzo
Da 25/09/2024
34
Vendite