
Penerangan
Engulfing Candle PRO - Pengesan Corak Engulfing Profesional
Secara automatik mengesan corak Engulfing dengan Engulfing Candle PRO, penunjuk teknikal yang mengenal pasti dan menyerlahkan isyarat pembalikan yang kuat pada carta anda.
Apakah Corak Engulfing?
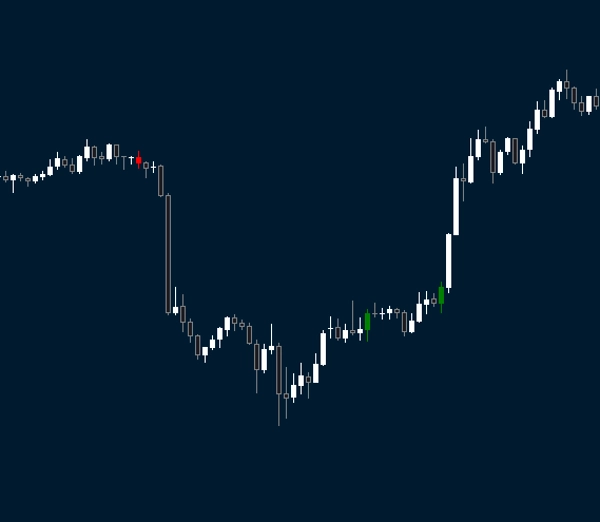
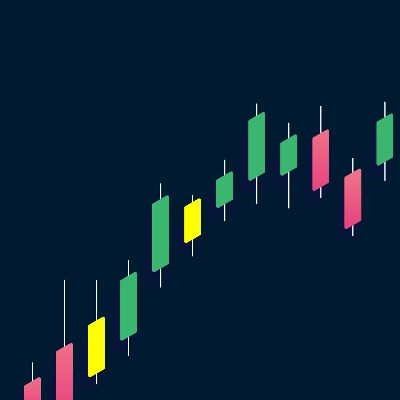
Corak Engulfing berlaku apabila lilin sepenuhnya menelan julat lilin sebelumnya (tinggi lebih tinggi dan rendah lebih rendah), dan ditutup dengan kuat ke arah tren baru.
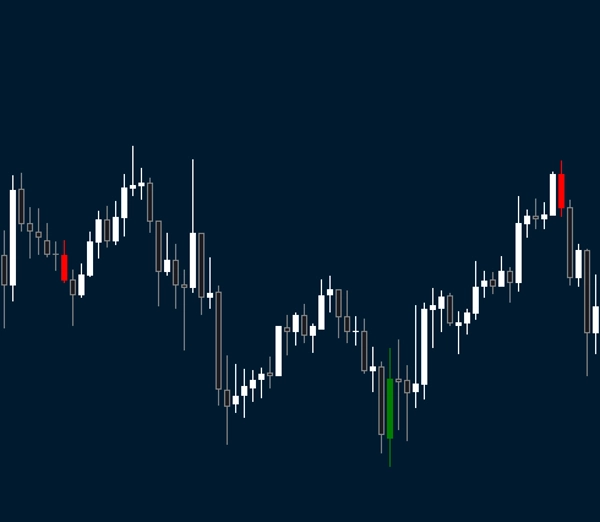
- Bullish Engulfing: Lilin hijau (naik) yang sepenuhnya menelan lilin sebelumnya, menunjukkan tekanan beli yang kuat dan potensi pembalikan ke atas.
- Bearish Engulfing: Lilin merah (turun) yang sepenuhnya menelan lilin sebelumnya, menunjukkan tekanan jual yang kuat dan potensi pembalikan ke bawah.
Ciri-ciri Utama:
- Pengesanan Masa Nyata Automatik: Segera mengesan corak Bullish dan Bearish Engulfing semasa ia terbentuk.
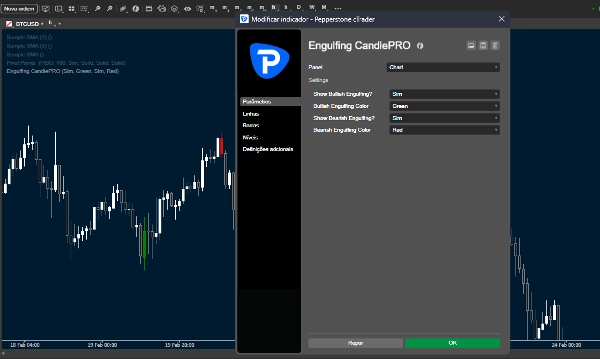
- Kawalan Bebas: Pilih untuk memaparkan kedua-dua corak atau fokus hanya pada set Bullish atau Bearish.
- Penyerlah Visual: Warna boleh disesuaikan untuk kedua-dua corak Bullish dan Bearish, membolehkan integrasi lancar dengan templat carta anda.
- Penapisan Lanjutan: Menapis isyarat palsu dengan memastikan lilin engulfing ditutup dengan tujuan ke arah tren (mengabaikan Doji).
- Prestasi Dioptimumkan: Kod ringan untuk operasi lancar di semua carta.
Mengapa Menggunakan Engulfing Candle PRO?
- Kenal Pasti Pembalikan Awal: Tangkap perubahan tren utama tepat pada titik pusingan.
- Tingkatkan Analisis Visual: Berhenti memaksa mata anda mencari formasi candlestick yang halus.
- Jimat Masa: Biarkan penunjuk mengimbas pasaran untuk anda.
- Perbaiki Masuk Dagangan: Gabungkan dengan sokongan/rintangan untuk setup berkemungkinan tinggi.
Penyesuaian:
Pilih daripada 9 warna berbeza untuk menyerlahkan corak Bullish dan Bearish Engulfing secara bebas, menyesuaikan penunjuk dengan sempurna kepada gaya visual anda.
Keserasian:
Berfungsi pada semua instrumen (Forex, Indeks, Saham, Kriptokurensi) dan mana-mana jangka masa.
Ringkasan
Key features include customizable visual highlighting with nine color options for each pattern type, independent controls to display either or both Bullish and Bearish signals, and advanced filtering to reduce false signals by excluding Doji candles. The indicator is optimized for performance to operate smoothly across charts.
Engulfing Candle PRO aims to assist traders in early identification of trend reversals, enhance visual analysis by clearly marking patterns, save time by automating pattern detection, and improve trade entries when combined with support and resistance levels.
Ulasan pelanggan
5 | 0 % | |
4 | 100 % | |
3 | 0 % | |
2 | 0 % | |
1 | 0 % |
![Logo "[Hamster-Coder] Pivot Points MTF"](https://cdn.ctrader.com/image/webp/4c143e5a-309c-40e3-a578-f04d1e133ffa_31159)


![Logo "[Stellar Strategies] Inside Bar with Signals"](https://cdn.ctrader.com/image/webp/1d9e8bfa-3b2c-4440-bb37-5856902008a7_30683)


