
Penerangan
Pinescritlabs
Penunjuk Kedai Ctrader: 🤖Pinescritlabs cBots Kedai Ctrader:
Sesi Jurang Nilai Adil Pivots Sesi Pecah Emas & BTC(baru)
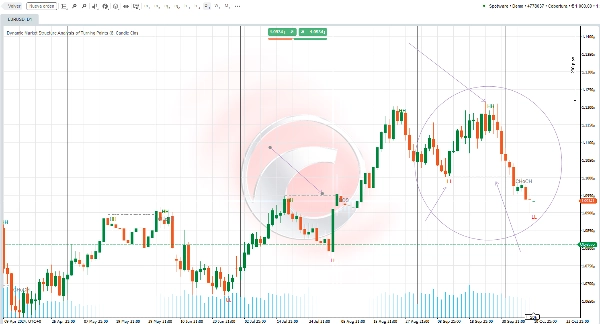
Struktur Pasaran Dinamik
Analisis Titik Perubahan
Fibonacci Linear
Regresi Pelbagai Jangka Masa
Bias Lilin Berbilang Tahap
Penjejak
Sokongan Auto dan
Garis Trend Rintangan
Semua Tahap Sokongan dan
Rintangan
Gambaran Keseluruhan Tetapan Penunjuk 🌟
PANJANG AYUNAN 📏
Parameter ini menentukan berapa banyak bar yang dianggap ke kiri dan kanan semasa mencari titik ayunan. Nilai yang lebih rendah akan menunjukkan lebih banyak titik, manakala nilai yang lebih tinggi akan mengurangkan kuantitinya. Disyorkan untuk melaraskan parameter ini berdasarkan gaya perdagangan anda dan apabila bertukar antara jangka masa yang berbeza.
CHOCH 🔄
Mengaktifkan pilihan ini akan menamakan semula pecahan lawan arah pertama sebagai CHoCH (Perubahan Watak), dengan itu menunjukkan kemungkinan perubahan arah pasaran.
HH dan LL 📈📉
Penunjuk akan melukis titik tinggi ayunan (HH) dan titik rendah ayunan (LL) pada carta, membolehkan anda memvisualisasikan struktur pasaran dengan lebih berkesan.
BOS ⚡
Penunjuk juga akan memaparkan tahap Pecah Struktur (BOS) apabila mengesan pecahan pada titik ayunan, memberikan pandangan tambahan tentang dinamik pasaran.
Ringkasan
Ulasan pelanggan
5 | 33 % | |
4 | 67 % | |
3 | 0 % | |
2 | 0 % | |
1 | 0 % |


