
Penerangan
📊 TrendHeikinMultiMA – Algoritma Trend Lanjutan
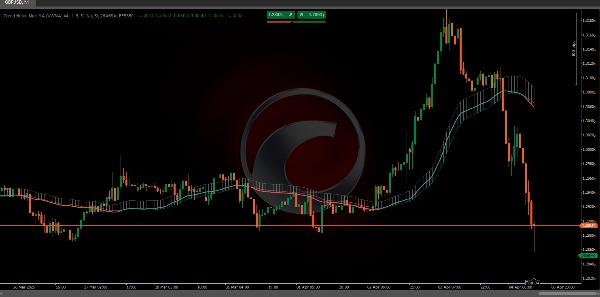
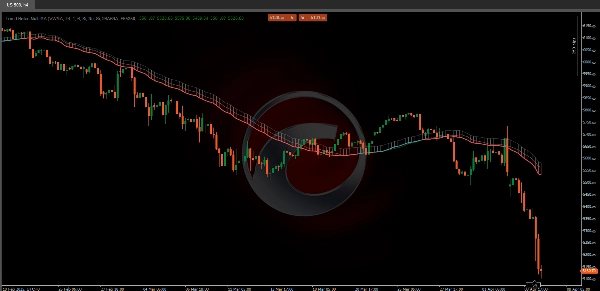
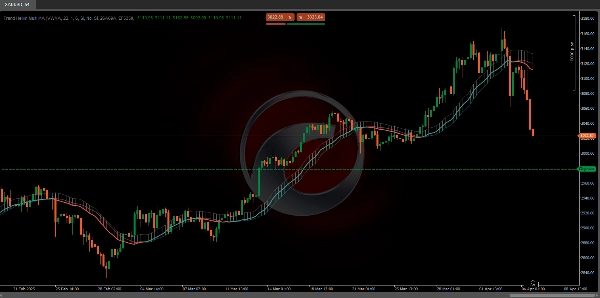
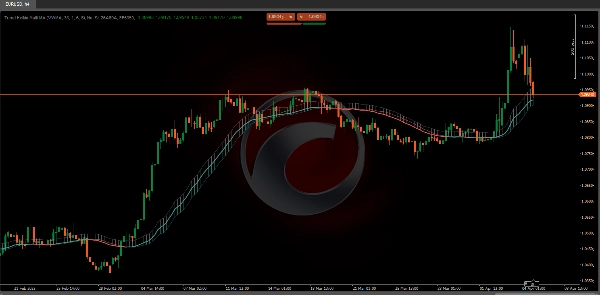
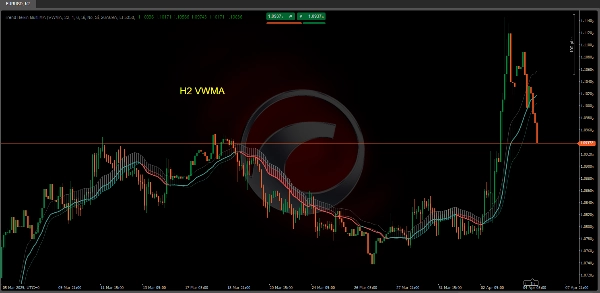
Algoritma TrendHeikinMultiMA direka untuk mengira nilai trend daripada data harga, menggunakan formula Heikin-Ashi untuk melicinkan nilai-nilai ini dan menggunakan pelbagai jenis purata bergerak (ALMA, HMA, SMA, SWMA, VWMA, WMA, ZLEMA, atau EMA).
Walaupun nilai Heikin-Ashi digunakan secara dalaman, carta tidak memaparkan lilin Heikin-Ashi tradisional. Sebaliknya, ia melukis garis trend berdasarkan nilai yang dilicinkan, menjadikan arah pasaran lebih mudah ditafsirkan tanpa kerumitan visual carta lilin.
🔄 1. Peranan Pelicinan
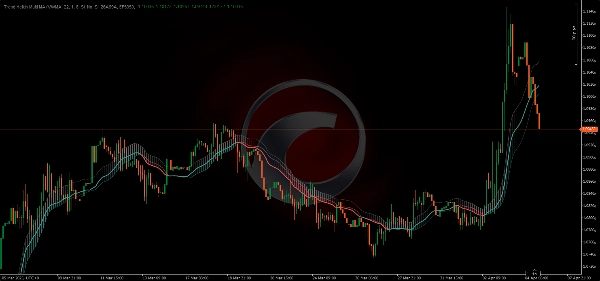
Oleh kerana nilai trend diperoleh daripada pelicinan Heikin-Ashi yang digabungkan dengan purata bergerak, perubahan warna dalam TrendHeikinMultiMA tidak berlaku serta-merta apabila harga melintasi garis trend:
- 🔹 Harga mungkin bergerak sementara di atas atau di bawah garis trend tanpa mencetuskan perubahan warna.
- 🔹 Ini berlaku kerana penunjuk menunggu perbezaan yang ketara dan berterusan antara nilai buka dan tutup yang dilicinkan untuk mengesahkan pembalikan trend sebenar.
✅ Kelebihan dalam Tafsiran
Penangguhan yang disengajakan dalam perubahan warna ini membantu mengelakkan isyarat palsu. Dalam carta lilin tradisional, harga mungkin melintasi garis trend secara singkat dan mencetuskan isyarat awal.
- 🟥 Sebagai contoh, walaupun harga semasa berada di atas garis trend menurun, penunjuk akan kekal merah (menurun) sehingga nilai yang dilicinkan mengesahkan bahawa tutup secara konsisten lebih tinggi daripada buka.
- 🟩 Begitu juga, untuk bertukar kepada hijau (menaik), purata bergerak berasaskan Heikin-Ashi mesti mengesahkan bahawa tutup secara konsisten melebihi buka.
📈 2. Menggunakan Purata Bergerak pada Nilai Heikin-Ashi
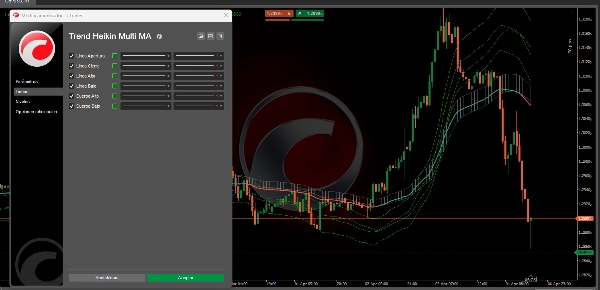
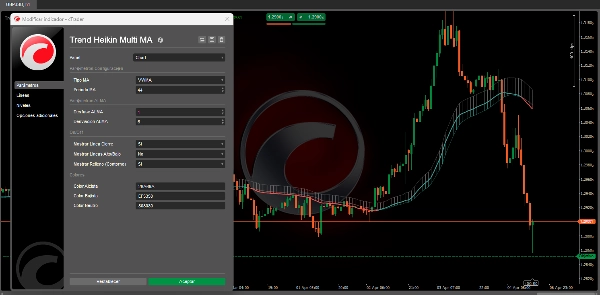
- 🔄 Pemilihan Purata Bergerak:
-
- Pengguna boleh memilih antara pelbagai jenis purata bergerak (ALMA, HMA, SMA, SWMA, VWMA, WMA, ZLEMA, dan EMA).
- Setiap jenis PB menggunakan kaedah matematik khusus untuk memberi berat dan melicinkan nilai sejarah buka, tutup, tinggi, dan rendah yang diperoleh daripada Heikin-Ashi.
🏆 3. Kelebihan Menggunakan TrendHeikinMultiMA berbanding Lilin Tradisional
- 📉 Pengurangan Bunyi:
-
- Lilin tradisional sering memaparkan volatiliti tinggi dan data yang tersebar, menjadikan sukar untuk mengenal pasti trend keseluruhan.
- TrendHeikinMultiMA melicinkan data ini, menapis turun naik kecil dan menghapuskan ayunan mendadak, membolehkan pedagang menumpukan pada arah pasaran utama.
✅ Kesimpulan
Secara ringkas, TrendHeikinMultiMA meng sahkan perubahan trend (menaik atau menurun) hanya apabila nilai buka dan tutup yang dilicinkan—yang dikira dari Heikin-Ashi dan diproses melalui purata bergerak yang dipilih—secara konsisten menunjukkan bahawa tingkah laku pasaran telah membalikkan arahannya.
Ini memastikan bahawa isyarat lebih boleh dipercayai dan kurang terjejas oleh bunyi yang dilihat dalam carta lilin tradisional. 🚀📊
🔥 Penunjuk Kedai Pinescritlabs Ctrader 🔥
Struktur Pasaran Dinamik
Analisis Titik Pusingan
Fibonacci Linear
Regresi Multi-masa
Bias Lilin Berbilang Tahap
Penjejak
Garis Trend Sokongan dan
Rintangan Auto
Semua Tahap Sokongan dan
Rintangan
Ringkasan
The indicator incorporates a smoothing mechanism that delays color changes to confirm trend reversals only after a significant and sustained difference between smoothed open and close values is detected. This approach reduces false signals caused by brief price fluctuations crossing trend lines.
Users can select from multiple moving average types, each applying distinct mathematical weighting methods to the Heikin-Ashi-derived open, close, high, and low values, enhancing customization and adaptability to different trading styles.
Compared to traditional candlestick charts, Trend Heikin Multi MA filters out minor price fluctuations and abrupt swings, allowing traders to focus on primary market trends with more reliable signals. It confirms bullish or bearish trend changes only when smoothed values consistently indicate a market direction reversal, improving signal accuracy and reducing noise.
Ulasan pelanggan
5 | 33 % | |
4 | 67 % | |
3 | 0 % | |
2 | 0 % | |
1 | 0 % |


