present
Regístrese y obtenga 50 $ de descuento en su primera compra
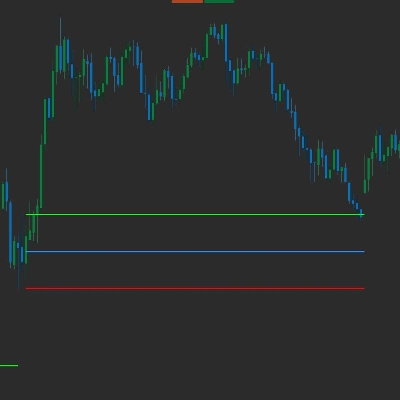
Trading product for IR Coral Indicador, image 1
IR Coral
5.0
Valoraciones: 1
5.64K
Instalaciones gratis

Descripción

Indicador de coral


Resumen

Resumen de IA
IR Coral is a technical indicator designed for use in trading platforms. It provides analytical insights based on market data to assist traders in making informed decisions. The product functions as a standalone indicator without specified trading strategies, timeframes, or market symbols. It does not include built-in risk management parameters or position sizing guidelines. IR Coral is intended for integration within trading interfaces to enhance market analysis through its indicator outputs.
Perfil del indicador

Conversación

Valoraciones de clientes

5.0
Valoraciones: 1
5
100 %
4
0 %
3
0 %
2
0 %
1
0 %
Valoraciones de clientes
August 2, 2025

Preguntas frecuentes

Los productos disponibles a través de cTrader Store, incluidos bots, indicadores y plugins para operar, son proporcionados por desarrolladores de terceros y están disponibles únicamente con fines informativos y de acceso técnico. cTrader Store no es un bróker, por lo que no proporciona asesoramiento de inversión, recomendaciones personales ni ninguna garantía de rentabilidad futura.

Más de este autor

Logotipo de "IR Candle MTF"
4.6
(6)
Gratis
with this indicator you could see other time frame candle in your chart.
show spread on chart
some user add moving average to macd to see better. in ctrader 4.3.11 there is a problem with this . I make a macd tha
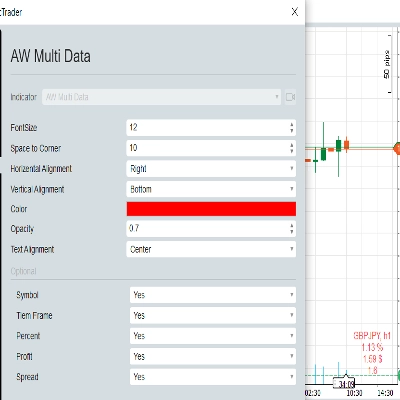
this indicator show macd on chart.
Multi Time Frame Moving Average is a powerful and flexible indicator for cTrader
 this moving include everything that a trader needs from Moving Average.
this indicaotr show distance between Tenkan to Kijun, Close to Kijun and Close to Tenkan 
Add Slowing to IR Moving Average.
IR Candle Open plots customizable opening price lines for daily, weekly, and monthly candles
you could put your check list in your chart you could split your test with “,” you could put your checklist in indicat
this indicator show other time frame close in lower time frame. for ex: show daily close in m 15.
don't move to the end of chart after timeframe changing. it should be better to use for near history. for long history

Puede interesarle

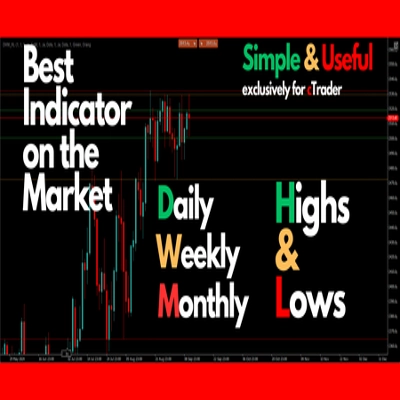
Daily/Weekly/Monthly - Highs & Lows Indicator (Customizable Settings)
Logotipo de "OrderPrice-V3"
4.0
(4)
$19
A straightforward yet effective tool signals entry points for both buying and selling. Include 3 Moving Average
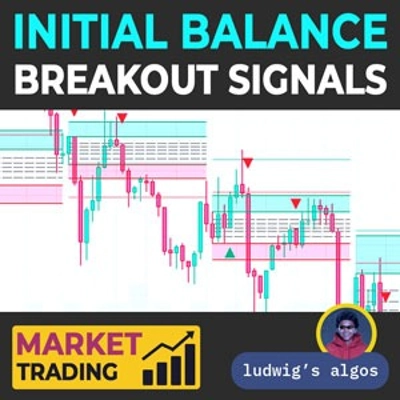
📈 Initial Balance Breakout Signals: visually accurate IB levels, breakout alerts & forecast zones for smart trading.
cTreder Smart SMA
Institutional Session Levels Pro OHLC,Prev(D,W,M OHLC)
Unlock trading precision with QQE! Dual QQE indicators with a Bollinger Bands zero line provide clear buy/sell signals.
Trading.FC$_vwap Algo shows VWAP trends, dynamic support/resistance and deviation bands to spot potential trade entries.
Compare up to 27 symbols across eight timeframes with seven analysis engines and an interactive cTrader dashboard.
institutional-level market analysis
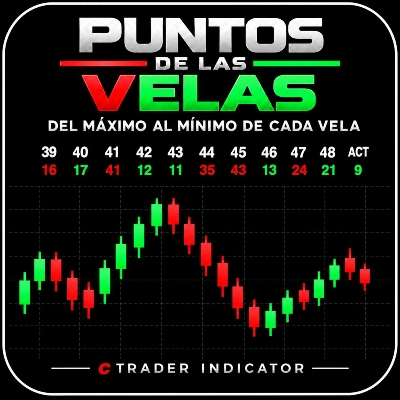
Mide en puntos la distancia entre el Máximo y el Mínimo alcanzados por cada vela, incluida la vela actual.
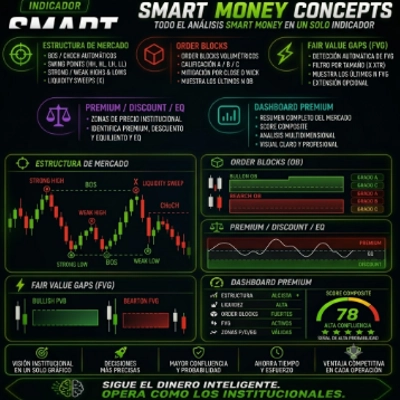
Smart Money Concepts Automate your institutional analysis and make decisions with pinpoint precision..
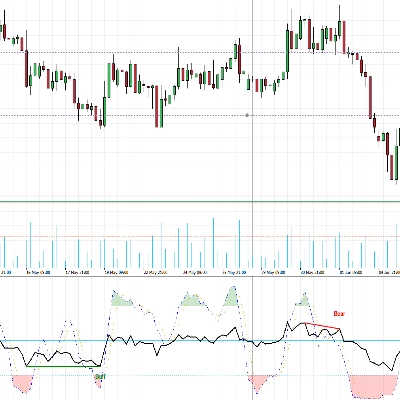
Unlock Stochastic RSI PRO in cTrader! Overlay RSI, highlight zones, and identify divergences with customizable settings.
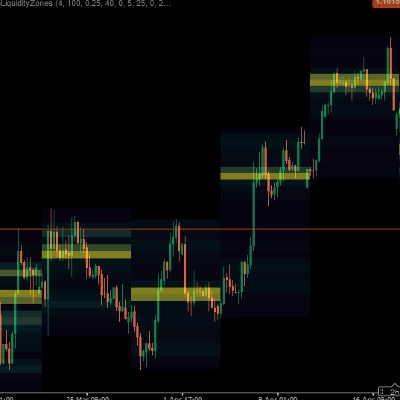
Heatmap Liquidity Zones Visualize volume-at-price, uncover hidden support/resistance, and track market liquidity in real
The Dominator SMC Base, Smart Money Concept Indicator.
GOLD SENTINEL v1.0 - A CANDLE-COLORING INDICATOR FOR GOLD.
This indicator plots the 15m opening range of the NY session with the first N FVGs presented on the chart after the open
 this moving include everything that a trader needs from Moving Average.
Professional Volume Profile Indicator - Shows volume distribution, POC, Value Areas & Buy/Sell pressure.

Precio

5.64K
Instalaciones gratis