
IR Candle MTF
مؤشر
2.01K التنزيلات
الإصدار 1.0، Jan 2025
Windows, Mac
4.6
التقييمات: 5
الوصف
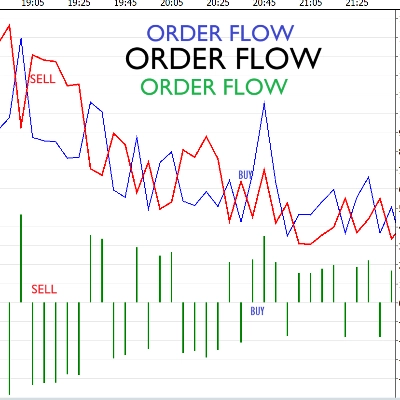
مع هذا المؤشر يمكنك رؤية شمعة إطار زمني آخر في الرسم البياني الخاص بك.
الملخص
ملخص الذكاء الاصطناعي
IR Candle MTF is a trading indicator that allows users to view candlestick data from different time frames directly on their current chart. This functionality enables traders to analyze multiple time frames simultaneously without switching charts, facilitating a more comprehensive market overview. The indicator integrates seamlessly into existing charts, displaying higher or lower time frame candles overlaid on the active chart timeframe. It supports various time frames as per user needs, enhancing multi-time frame analysis for improved decision-making.
ملف تعريف المؤشر
تقييمات العملاء
4.6
التقييمات: 5
5 | 60 % | |
4 | 40 % | |
3 | 0 % | |
2 | 0 % | |
1 | 0 % |
تقييمات العملاء
July 9, 2025
Pros: Displays higher timeframe candles on lower charts. Clear visualization, easy setup, useful for multi-timeframe analysis. Cons: No tooltips or OHLC data on candles. Can't save templates. Lacks filtering by candle patterns or integrated alerts.
July 3, 2025
July 3, 2025
or if the thickness of the wick could be increased without emphasizing the outline of the candle.
April 14, 2025
I had tried creating something similar previously but yours is better, I would suggest adding an option to have an outer box act as a candle wick to make it easy on the eyes
مناقشة
الأسئلة الشائعة
يتم توفير المنتجات المتاحة من خلال cTrader Store، بما في ذلك روبوتات التداول والمؤشرات والإضافات، من قبل مطوري الطرف الثالث وإتاحتها لأغراض الوصول المعلوماتي والفني فقط. cTrader Store ليس وسيطًا ولا يقدم نصائح استثمارية أو توصيات شخصية أو أي ضمان للأداء المستقبلي.
المزيد من هذا المؤلف


![شعار "[Hamster-Coder] Moving Average MTF"](https://cdn.ctrader.com/image/webp/b11b98b1-194d-4b8e-b00e-d611826ad159_31226)

![شعار "[Stellar Strategies] Market Session Ultimate"](https://cdn.ctrader.com/image/webp/61ffd537-0125-4246-9e72-42eca1791d64_28232)


السعر
5.11K
التثبيتات المجانية