
Range 10 Rsi
مؤشر
128 التنزيلات
الإصدار 1.0، Aug 2025
Windows, Mac
الوصف
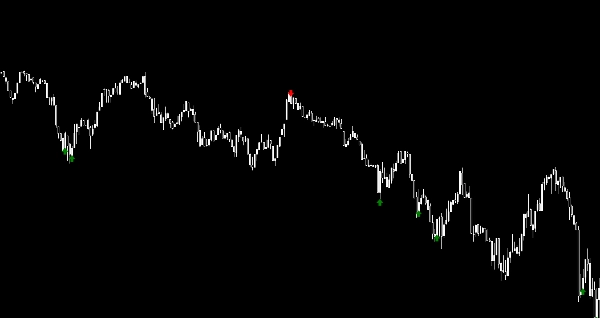
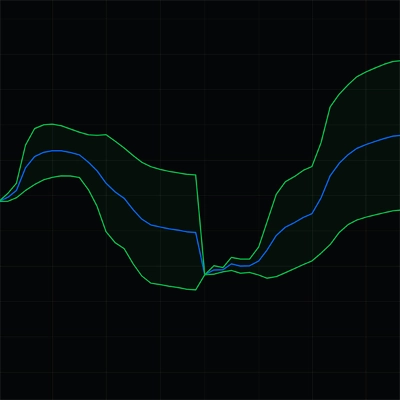
يقوم روبوت RSI Scalping cBot بأتمتة كامل سير عمل السكالبينج: من اكتشاف إشارة RSI إلى تنفيذ الأوامر وإدارة الخروج. يعتمد على التقلبات، حيث يلتقط تحركات الأسعار قصيرة الأمد في الوقت الحقيقي. استمتع بالسكالبينج بدون تدخل يدوي بدقة احترافية.
الملخص
ملخص الذكاء الاصطناعي
Range 10 RSI is an automated scalping indicator that uses the Relative Strength Index (RSI) to identify trading signals in volatile, choppy markets. It automates the entire scalping process, including signal detection, order execution, and exit management, enabling rapid trades that capture short-term price movements. Designed for hands-free operation, this tool aims to deliver precise and timely scalping actions based on real-time RSI analysis.
ملف تعريف المؤشر
تقييمات العملاء
0.0
التقييمات: 0
تقييمات العملاء
لا توجد تقييمات لهذا المنتج حتى الآن. هل جرَّبته بالفعل؟ كن أول من يخبر الآخرين!
مناقشة
الأسئلة الشائعة
يتم توفير المنتجات المتاحة من خلال cTrader Store، بما في ذلك روبوتات التداول والمؤشرات والإضافات، من قبل مطوري الطرف الثالث وإتاحتها لأغراض الوصول المعلوماتي والفني فقط. cTrader Store ليس وسيطًا ولا يقدم نصائح استثمارية أو توصيات شخصية أو أي ضمان للأداء المستقبلي.


السعر
منذ 03/08/2025
128
التثبيتات المجانية