
Trend Cycle
مؤشر
181 التنزيلات
الإصدار 1.0، Nov 2025
Windows, Mac
الوصف
دورة الاتجاه هي أداة تحليل اتجاه تركز على مدة الاتجاه، وليس فقط الاتجاه.
إنها:
- تكتشف الاتجاهات الصاعدة و الهابطة بناءً على ميل المتوسط المتحرك لهول (HMA).
- تحسب عدد الأعمدة التي كان فيها الاتجاه الحالي نشطًا (الطول الحقيقي).
- تخزن أطوال الاتجاهات الصاعدة و الاتجاهات الهابطة بشكل منفصل.
- تحسب متوسط الطول للاتجاهات الصاعدة والهابطة (متوسط الصعود / متوسط الهبوط).
- ترسم:
-
- متوسط متحرك لهول أخضر خلال الاتجاهات الصاعدة و أحمر خلال الاتجاهات الهابطة.
- خطوط إسقاط أفقية عند بداية كل اتجاه، مع تسمية مثل
PL: 18(الطول المحتمل بالأعمدة). - تسمية حية بالقرب من السعر الحالي تظهر اتجاه الاتجاه والطول الحقيقي.
- لوحة عرض مع:
-
- متوسط مدة الاتجاهات الصاعدة والهابطة،
- قوائم بأطوال الاتجاهات الأخيرة (حتى حجم العينة المحدد).
الهدف هو مساعدتك على الإجابة على:
"كم عمر هذا الاتجاه، وكم تدوم الاتجاهات المماثلة عادة؟"
كيف يعمل (المنطق)
- المتوسط المتحرك لهول (HMA)
يقوم المؤشر بحساب المتوسط المتحرك لهول لسعر الإغلاق باستخدام طول تمليس HMA كمعامل.
المتوسط المتحرك لهول أكثر نعومة من المتوسط البسيط/EMA لكنه يستجيب بسرعة لتغيرات الاتجاه. - كشف الاتجاه بواسطة الميل
خلال آخر حساسية كشف الاتجاه أعمدة، يتحقق من HMA:
طالما تم تعريف اتجاه، يتم زيادة عداد (الطول الحقيقي) في كل عمود، مما يمثل مدة الاتجاه الحالي. -
- إذا كان HMA يرتفع بشكل صارم → الاتجاه صاعد (↑).
- إذا كان HMA ينخفض بشكل صارم → الاتجاه هابط (↓).
- وإلا، يحتفظ بحالة الاتجاه السابقة.
- تسجيل أطوال الاتجاهات
عندما يتحول الاتجاه من صاعد إلى هابط أو العكس: -
- يتم تخزين مدة الاتجاه المكتمل:
-
- الاتجاهات الصاعدة في قائمة الصعود،
- الاتجاهات الهابطة في قائمة الهبوط.
- كل قائمة محدودة بـ حجم عينة الاتجاه (مثلاً آخر 10 اتجاهات).
- تُستخدم هذه العينات لحساب:
-
- متوسط الصعود = متوسط طول الاتجاه الصاعد.
- متوسط الهبوط = متوسط طول الاتجاه الهابط.
- إسقاطات الطول المحتمل
عند بداية كل اتجاه جديد، إذا كانت هناك عينات كافية:
يتم الاحتفاظ بهذه الإسقاطات على الرسم كجزء من التاريخ حتى تتمكن من المقارنة بصريًا بين مدة الاتجاه المتوقعة والفعلية. -
- يحسب المتوسط لطول ذلك النوع من الاتجاه (صاعد أو هابط).
- يرسم خطًا أفقيًا من عمود بداية الاتجاه لعدد تقريبي من الأعمدة.
- يضع تسمية في مركز الخط:
-
PL: X→ الطول المحتمل = X أعمدة.
- تسمية حية
في كل عمود، يرسم المؤشر تسمية حية واحدة بالقرب من HMA:
تُظهر هذه اتجاه الاتجاه الحالي و عدد الأعمدة التي استمر فيها حتى الآن بالضبط. -
- نص المثال:
-
الاتجاه ↑
الطول الحقيقي: 7
- اللون:
-
- أخضر (↑) للاتجاهات الصاعدة
- برتقالي/أحمر (↓) للاتجاهات الهابطة
- لوحة العرض (أسفل اليسار)
عندما يتم تفعيل إظهار لوحة العرض، تظهر لوحة نص ثابتة في زاوية الرسم البياني تعرض:
تعمل هذه كلمحة إحصائية سريعة عن سلوك الاتجاهات الأخيرة على ذلك الرمز/الإطار الزمني. -
- العنوان: دورة الاتجاه
متوسط الصعود: X أعمدةمتوسط الهبوط: Y أعمدةعينات الصعود:قائمة بأطوال الاتجاهات الصاعدة الأخيرةعينات الهبوط:قائمة بأطوال الاتجاهات الهابطة الأخيرة
كيفية قراءته عمليًا
- HMA أخضر + "الاتجاه ↑"
→ اتجاه صاعد نشط.
→الطول الحقيقييخبرك بعدد الأعمدة التي استمر فيها حتى الآن.
→ الخطPL: Xالأخير يعطيك فكرة بصرية عن مدة الاتجاهات الصاعدة المماثلة. - HMA أحمر + "الاتجاه ↓"
→ اتجاه هابط نشط.
→الطول الحقيقي= عمر الاتجاه الهابط الحالي.
→ قارن الطول الحقيقي معمتوسط الهبوطفي اللوحة لترى إذا كانت الحركة حديثة أو ناضجة. - عندما يقترب الطول الحقيقي أو يتجاوز المتوسط (متوسط الصعود / متوسط الهبوط):
→ الاتجاه الحالي "قديم" إحصائيًا مقارنة بالتاريخ الحديث.
→ قد تختار: -
- تشديد وقف الخسائر،
- تحقيق الأرباح،
- أن تكون أكثر حذرًا مع الدخولات الجديدة في ذلك الاتجاه.
- الاتجاهات القصيرة مقابل الاتجاهات الطويلة
-
- الكثير من الاتجاهات القصيرة جدًا → بيئة متقلبة / عائدة إلى المتوسط.
- قليل من الاتجاهات الطويلة → سوق أكثر اتجاهًا، مع تحركات ممتدة.
الملخص
ملخص الذكاء الاصطناعي
Trend Cycle is a technical indicator designed to analyze trend duration in financial markets. It detects bullish and bearish trends by evaluating the slope of a Hull Moving Average (HMA) applied to closing prices, providing a smoother yet responsive measure of trend direction. The indicator counts the number of bars the current trend has been active (Real Length) and records the lengths of recent up-trends and down-trends separately. Using these samples, it calculates average durations for bullish and bearish trends.
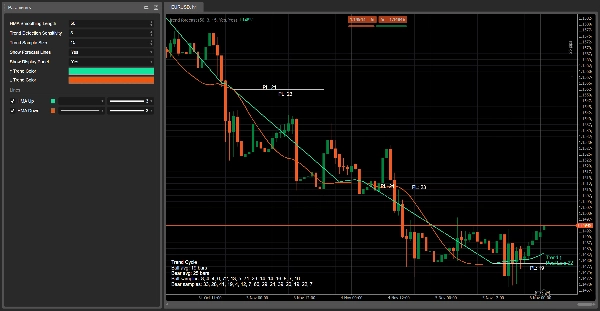
Visual elements include a green HMA line during bullish trends and a red HMA line during bearish trends. Horizontal projection lines mark the probable length of each trend at its start, labeled with "PL: X" to indicate expected duration in bars. A live label near the current price displays the active trend direction and its age in bars. An optional display panel offers a summary of average trend durations and recent trend length samples.
Trend Cycle helps users assess how long the current trend has lasted relative to historical trends, aiding decisions such as adjusting stops or managing entries. It supports analysis across various markets including Forex, cryptocurrencies, indices, commodities, and stocks.
ملف تعريف المؤشر
تقييمات العملاء
0.0
التقييمات: 0
تقييمات العملاء
لا توجد تقييمات لهذا المنتج حتى الآن. هل جرَّبته بالفعل؟ كن أول من يخبر الآخرين!
مناقشة
الأسئلة الشائعة
BTCUSD
Forex
Signal
Breakout
Indices
EURUSD
Commodities
GBPUSD
NZDUSD
Martingale
Bollinger
Prop
ZigZag
Scalping
Supertrend
Crypto
Grid
Stocks
AI
XAUUSD
NAS100
USDJPY
يتم توفير المنتجات المتاحة من خلال cTrader Store، بما في ذلك روبوتات التداول والمؤشرات والإضافات، من قبل مطوري الطرف الثالث وإتاحتها لأغراض الوصول المعلوماتي والفني فقط. cTrader Store ليس وسيطًا ولا يقدم نصائح استثمارية أو توصيات شخصية أو أي ضمان للأداء المستقبلي.


السعر
42.11M
حجم التداول
6.13M
الربح بالبيب
230
المبيعات
8.52K
التثبيتات المجانية