
AutoLines™ Support & Resistance
مؤشر
2 عمليات الشراء
الإصدار 1.0، May 2025
Windows, Mac
4.5
التقييمات: 4
الوصف
FlexSR هو مؤشر الدعم والمقاومة الاحترافي الشامل الخاص بك لمنصة cTrader. يقوم تلقائيًا بتحديد القمم والقيعان المحورية خلال فترة المراجعة التي تختارها، ويرسم حتى N من أحدث المستويات، ويمتد بها عبر الرسم البياني. مع ألوان قابلة للتخصيص بالكامل، وأنماط خطوط، وسماكة، وتسميات اختيارية للتاريخ والسعر، يمنحك FlexSR مناطق واضحة كالكريستال حيث من المحتمل أن يتوقف السعر أو ينقلب أو يخرج منها—حتى تتمكن من التداول بثقة.
الميزات الرئيسية
الملخص
ملخص الذكاء الاصطناعي
AutoLines™ Support & Resistance (FlexSR) is a professional indicator for cTrader that automatically detects pivot highs and lows over a user-defined lookback period. It plots up to N of the most recent support and resistance levels and extends these lines across the chart for continuous visibility. The indicator features customizable colors, line styles, thickness (1–5 px), and optional date-price labels for clear identification of key zones where price may stall, reverse, or break out.
Key functionalities include:
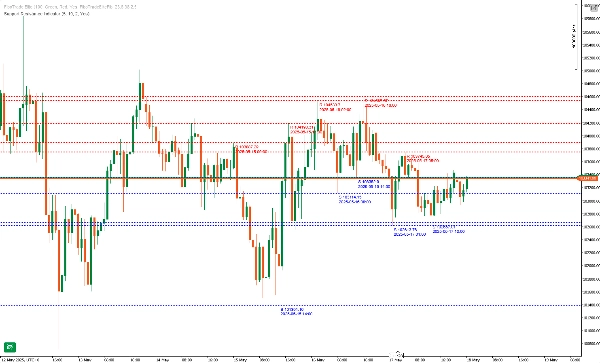
- Automatic pivot detection scanning each bar for true swing highs and lows.
- Dynamic management of displayed levels, showing only the user-set maximum number of lines to maintain chart clarity.
- Non-interactive, lockable lines that redraw automatically to prevent accidental changes.
- Real-time updates on every tick, ensuring levels remain current even in fast markets.
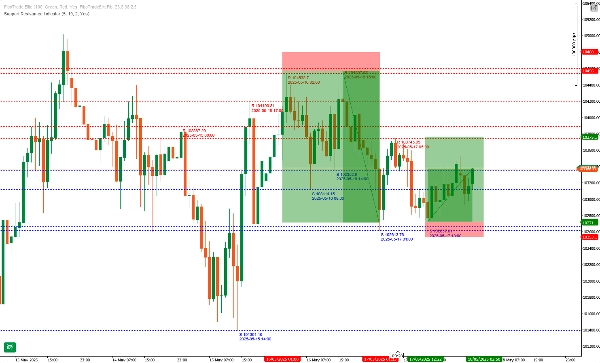
FlexSR supports intuitive trade management by visually highlighting confluence zones and providing clear support and resistance references. It is designed for ease of use with sensible default settings and minimal configuration. The indicator aids traders in identifying potential reversal and breakout points, supporting various trading strategies with precise and reliable level plotting.
Key functionalities include:
- Automatic pivot detection scanning each bar for true swing highs and lows.
- Dynamic management of displayed levels, showing only the user-set maximum number of lines to maintain chart clarity.
- Non-interactive, lockable lines that redraw automatically to prevent accidental changes.
- Real-time updates on every tick, ensuring levels remain current even in fast markets.
FlexSR supports intuitive trade management by visually highlighting confluence zones and providing clear support and resistance references. It is designed for ease of use with sensible default settings and minimal configuration. The indicator aids traders in identifying potential reversal and breakout points, supporting various trading strategies with precise and reliable level plotting.
ملف تعريف المؤشر
تقييمات العملاء
4.5
التقييمات: 4
5 | 50 % | |
4 | 50 % | |
3 | 0 % | |
2 | 0 % | |
1 | 0 % |
تقييمات العملاء
November 9, 2025
AutoLines™ S&R does the heavy lifting - clear, dynamic levels that adapt to price action. Perfect for traders who love clean charts and structure. Missing alerts, but performance and accuracy make it a must-have for support/resistance setups.
May 30, 2025
May 28, 2025
May 24, 2025
messy signals are easier to question, but overconfidence is the real danger.
مناقشة
الأسئلة الشائعة
Breakout
يتم توفير المنتجات المتاحة من خلال cTrader Store، بما في ذلك روبوتات التداول والمؤشرات والإضافات، من قبل مطوري الطرف الثالث وإتاحتها لأغراض الوصول المعلوماتي والفني فقط. cTrader Store ليس وسيطًا ولا يقدم نصائح استثمارية أو توصيات شخصية أو أي ضمان للأداء المستقبلي.


![شعار "High-Low Divergence [Iridio Capital]"](https://cdn.ctrader.com/image/webp/443c4661-7abb-40f1-842f-4b6ec560649b_40914)


السعر
منذ 22/11/2024
133
المبيعات
2.58K
التثبيتات المجانية