present
سجل واحصل على خصم 50 دولارًا على مشترياتك الأولى
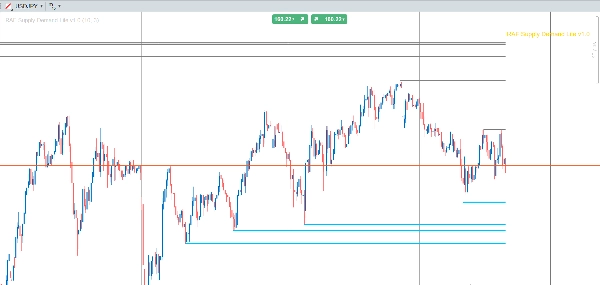
Trading product for RAF Supply Demand Lite v1.0 مؤشر Supply & Demand Support & Resistance, image 1
RAF Supply Demand Lite v1.0
مؤشر
3 عمليات الشراء
الإصدار 1.0، Jun 2026
Windows, Mac
5.0
التقييمات: 1
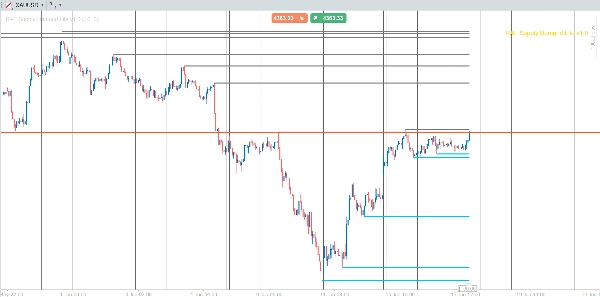
Trading product for RAF Supply Demand Lite v1.0 مؤشر Supply & Demand Support & Resistance, image 2
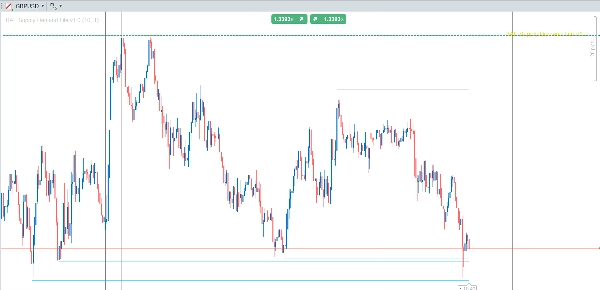
Trading product for RAF Supply Demand Lite v1.0 مؤشر Supply & Demand Support & Resistance, image 3
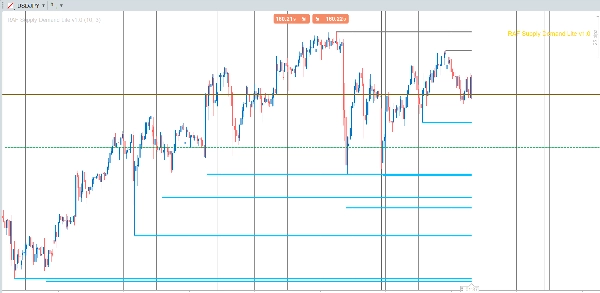
Trading product for RAF Supply Demand Lite v1.0 مؤشر Supply & Demand Support & Resistance, image 4
Trading product for RAF Supply Demand Lite v1.0 مؤشر Supply & Demand Support & Resistance, image 5
Trading product for RAF Supply Demand Lite v1.0 مؤشر Supply & Demand Support & Resistance, image 6
Trading product for RAF Supply Demand Lite v1.0 مؤشر Supply & Demand Support & Resistance, image 7
Trading product for RAF Supply Demand Lite v1.0 مؤشر Supply & Demand Support & Resistance, image 8
Trading product for RAF Supply Demand Lite v1.0 مؤشر Supply & Demand Support & Resistance, image 9
منذ 09/06/2026
4
المبيعات

الوصف

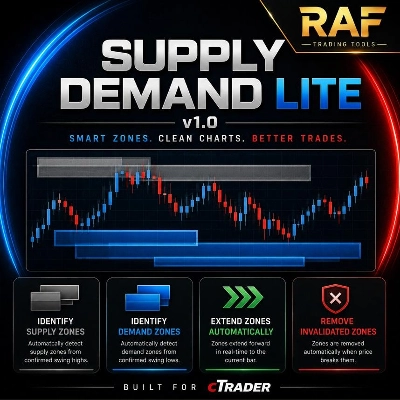
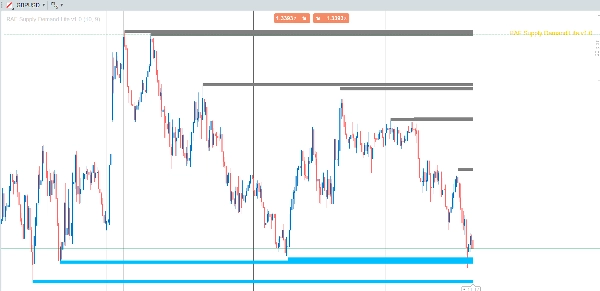
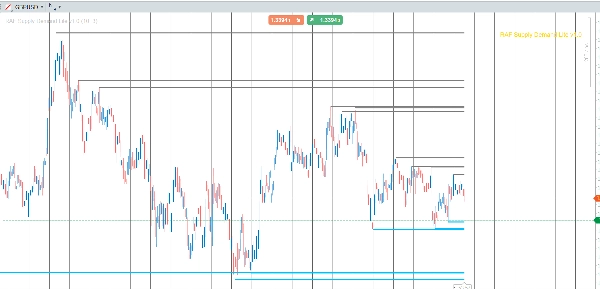
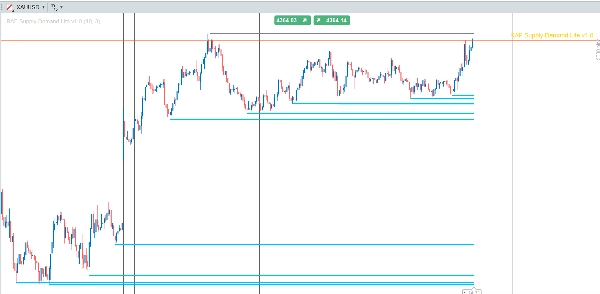
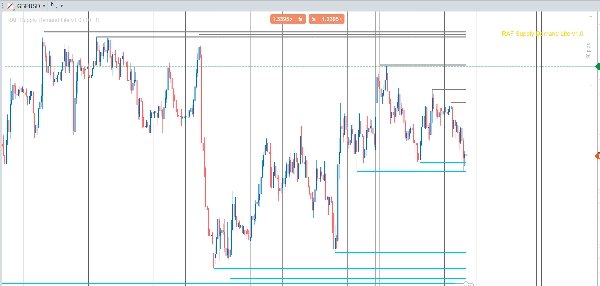
RAF Supply Demand Lite v1.0 هو أداة نظيفة وخفيفة الوزن وسهلة الاستخدام للمبتدئين مصممة لاكتشاف مناطق الدعم والمقاومة تلقائيًا باستخدام حركة السعر البحتة. تم بناؤها مع مراعاة البساطة والسرعة، مما يمنح المتداولين خريطة بصرية فورية لمستويات السوق الرئيسية بدون ازدحام أو ضوضاء أو تعقيد زائد.

يركز هذا الإصدار الخفيف على الأساسيات الجوهرية:

تحديد قمم وقيعان التأرجح الرئيسية

تحويلها إلى مناطق عرض (مقاومة) وطلب (دعم)

تمديد المناطق تلقائيًا مع تطور السعر

كشف كسر الهيكل (BOS) عند كسر المنطقة

إزالة المناطق غير الصالحة في الوقت الحقيقي

مثالي للمتداولين الذين يريدون أداة بسيطة وموثوقة وسريعة تعتمد على المناطق بدون تعقيد أنظمة SMC الكاملة.

🔍 الميزات الرئيسية

مناطق العرض التلقائية

تم إنشاؤها من قمم محورية مؤكدة.

مناطق الطلب التلقائية

تم إنشاؤها من قيعان محورية مؤكدة.

كشف كسر الهيكل (BOS)

تُزال المناطق عندما يخترق السعر من خلالها، مما يحافظ على نظافة الرسم البياني الخاص بك.

تمديد المناطق تلقائيًا

تمتد المناطق تلقائيًا إلى الأمام مع تكوين شموع جديدة.

خفيف الوزن وسريع

لا تأخير، لا إعادة رسم، لا حسابات ثقيلة.

نمط RAF البصري النظيف

شعار العلامة المائية باللون الذهبي مضمّن لمظهر فاخر.

🎯 لمن هذا؟

المبتدئين الذين يتعلمون هيكل السوق

المتداولين الذين يريدون مستويات دعم/مقاومة نظيفة

متداولي حركة السعر

أي شخص يريد مؤشر مناطق بسيط وسريع وموثوق

هذا الإصدار الخفيف مقصود أن يكون بسيطًا — مثالي لبناء الثقة وفهم هيكل السوق قبل الترقية إلى أدوات أكثر تقدمًا.

الملخص

AI summary
RAF Supply Demand Lite v1.0 is an indicator designed to automatically identify key Support and Resistance zones on trading charts by detecting confirmed swing highs and lows. It converts these pivots into Supply (resistance) and Demand (support) zones, which are visually extended forward as new price data forms. The tool includes Break of Structure (BOS) detection, removing zones in real time when price breaks through them to maintain a clean chart. It operates without lag or repainting, focusing on simplicity and speed, making it suitable for beginners and price action traders seeking a straightforward zone-based analysis without complex market structure components. The indicator features a clean visual style with a gold branding watermark and is intended to help users build confidence in understanding market structure before moving to more advanced tools.
ملف تعريف المؤشر

تقييمات العملاء

5.0
التقييمات: 1
5
100 %
4
0 %
3
0 %
2
0 %
1
0 %
تقييمات العملاء
June 29, 2026
RAF Supply Demand Lite v1.0 delivers exactly what its description promises: a lightweight, beginner-friendly Supply & Demand indicator with automatic zone detection and excellent performance. While intentionally minimalistic, it provides a clean and practical way to visualize market structure without the complexity of advanced SMC systems.

مناقشة

الأسئلة الشائعة

Supply & Demand
Support & Resistance
يتم توفير المنتجات المتاحة من خلال cTrader Store، بما في ذلك روبوتات التداول والمؤشرات والإضافات، من قبل مطوري الطرف الثالث وإتاحتها لأغراض الوصول المعلوماتي والفني فقط. cTrader Store ليس وسيطًا ولا يقدم نصائح استثمارية أو توصيات شخصية أو أي ضمان للأداء المستقبلي.

المزيد من هذا المؤلف

cBot
EMA
MACD
+5
A disciplined MACD‑EMA trading bot with smart protection, timed SL control, and reliable automated trade execution.
1
عامل الربح
مؤشر
EMA
Volume
+4
Advanced volume‑profile tool with delta, HVN/LVN zones, and precise POC‑based trade signals.

قد يعجبك أيضًا

مؤشر
ATR
MSS
+5
Advanced market structure and institutional cycle mapper with visual reference cards and entry alerts
مؤشر
ATR
RSI
+6
💹 Define a price channel 📈 and determine trend direction (bullish 🟢 or bearish 🔴).
شعار "Average Cost Price"
الأعلى تقييمًا
4.5
(4)
$25
/
$39
مؤشر
Prop
Forex
+9
Average Cost Price helps you keep track of your open positions on the chart. In doing so, it provides lines and explanat
مؤشر
ATR
BOS
+5
Opening ranges, dynamic trend channels, and multi-scale breakout/retest analysis for clear intraday chart decisions.
مؤشر
Imbalance
Fair Value Gap
+1
Multi-symbol, multi-timeframe Fair Value Gaps in one panel.
مؤشر
RSI
BTCUSD
+5
Identify market structure effortlessly with swing highs, lows, CHoCH, and BOS levels for smart trading decisions! 📊🔍"
مؤشر
ADX
ATR
+2
GOLD SENTINEL v1.0 - A CANDLE-COLORING INDICATOR FOR GOLD.
مؤشر
Laser entries with pivot confirmation. No repaint, all timeframes. Professional results.
مؤشر
AI
Prop
+7
EMA Clouds, Multi-Timeframe (MTF) Overlay, Swing High/Low detection, and a smart Dashboard with neutral zone filtering.
شعار "CandleColourFlow_MultiFx"
الأعلى تقييمًا
4.4
(5)
$19
مؤشر
CandleColourFlow MultiFx - optimized to work on Fx Majors, Fx MInors, Fx Crosses
شعار "Zigzag Trend"
الأعلى تقييمًا
4.5
(4)
$25
/
$45
مؤشر
AI
ATR
+23
The ZigZag Trend is a market structure tool that filters out small price fluctuations and highlights major swing.
مؤشر
AI
Prop
+9
Phoenix Zones - Detector de Reversiones Críticas
مؤشر
RSI
XAUUSD
+2
Automatic ZigZag swings with dynamic support & resistance levels, labeling highs/lows for clear trend signals.
مؤشر
Inside Bar
Save time by lighting a candle to look within yourself in another temporality
مؤشر
ATR
Upgrade to ATR-RMA! Experience the precise ATR using Relative Moving Average for accurate volatility analysis in cTrader
مؤشر
ATR
SMC
+2
HTF POWER 3 ICT Power of 3 · M1 Precision · H4 Intelligence Auto-detect Accumulation → Manipulation → Distribution
مؤشر
ATR
RSI
+1
Super Trend Rsi ,ATR + trend change distance + dynamic Alpha, divergence/convergence
مؤشر
Prop
Forex
+7
The Parabolic SAR, or "Stop and Reverse," is a dynamic technical analysis tool.

السعر

منذ 09/06/2026
4
المبيعات