
说明
Candles Volume Delta 是一个强大且直观的指标,它将原始的逐笔成交量转化为可操作的交易洞察。通过根据买卖成交量压力为价格柱着色,它提供了市场情绪和强度的即时视觉提示,帮助您一眼识别潜在的趋势延续或反转。
主要特点
-
- 🟢 直观的成交量分析:根据买卖成交量主导为每个价格柱着色
- 📊 智能Delta计算:计算用户定义周期内的成交量差值
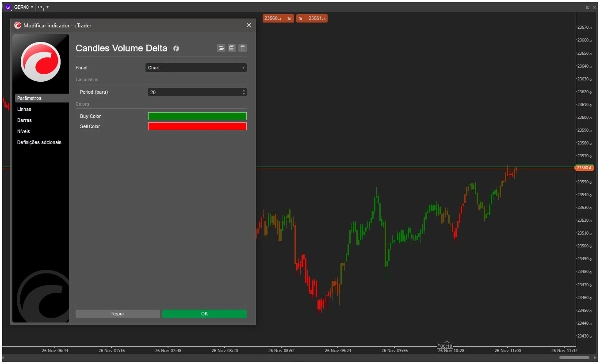
- 🎨 可定制颜色:完全可调的买卖颜色方案
- ⚡ 实时处理:针对新柱即时视觉反馈进行了优化
- 🛠️ 简易设置:简单配置,默认设置合理
工作原理
Candles Volume Delta 分析您指定周期内的逐笔成交量(默认:20根柱)并计算买入成交量与卖出成交量的百分比:
-
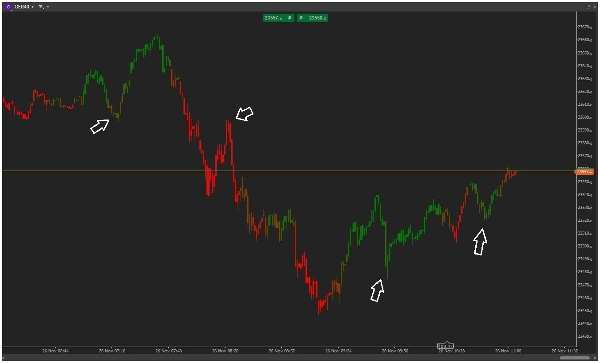
- 绿色柱:买入压力大(通常 >60% 买入成交量)
- 红色柱:卖出压力大(通常 <40% 买入成交量)
- 渐变色:平滑的颜色过渡显示中间强度水平
该指标使用基于ATR的平滑处理,确保信号稳定且有意义,能够适应当前市场波动性。
交易应用
-
- 趋势确认:通过成交量确认趋势强度
- 反转信号:当价格走势与成交量流向相悖时识别潜在反转
- 突破验证:用成交量证据确认突破
- 市场情绪:衡量任意时间框架内买卖双方的主导地位
为什么选择 Candles Volume Delta?
与那些使图表杂乱的复杂成交量指标不同,Candles Volume Delta 通过简单的颜色编码提供即时视觉反馈。它轻量、快速,提供您所需的关键成交量信息,而不会让数据过载。
非常适合希望:
-
- 快速评估市场情绪
- 清晰、无杂乱的图表分析
- 价格走势的视觉确认
- 轻松整合到现有策略中
今天就安装,透过成交量动态的视角看市场!
摘要
AI 摘要
Candles Volume Delta is a trading indicator that visually represents buy and sell volume pressure by coloring price bars based on the dominance of buying or selling activity. It calculates the volume delta over a user-defined period, typically 20 bars, using tick volume data and applies ATR-based smoothing to adapt to market volatility. Green bars indicate strong buying pressure (above 60% buy volume), red bars indicate strong selling pressure (below 40% buy volume), and gradient colors show intermediate levels of volume dominance.
Key features include customizable color schemes, real-time processing for instant visual feedback, and easy setup with sensible defaults. The indicator helps traders quickly assess market sentiment, confirm trends, identify potential reversals, validate breakouts, and gauge buyer/seller dominance across timeframes. It is designed to provide essential volume insights without cluttering the chart, making it suitable for integration into various trading strategies, including scalping and trend analysis. Supported markets include indices and other instruments where volume analysis is relevant.
Key features include customizable color schemes, real-time processing for instant visual feedback, and easy setup with sensible defaults. The indicator helps traders quickly assess market sentiment, confirm trends, identify potential reversals, validate breakouts, and gauge buyer/seller dominance across timeframes. It is designed to provide essential volume insights without cluttering the chart, making it suitable for integration into various trading strategies, including scalping and trend analysis. Supported markets include indices and other instruments where volume analysis is relevant.
指标配置
客户评价
5.0
评价:2
5 | 100 % | |
4 | 0 % | |
3 | 0 % | |
2 | 0 % | |
1 | 0 % |
客户评价
December 3, 2025
November 30, 2025
H1 makes the signal less noisy. It stops some messy trades from looking attractive.
讨论
常见问答
Signal
Scalping
Indices
Supertrend
SMC
Volume
ATR
cTrader Store 提供的所有产品,包括交易机器人、指标和插件,均由第三方开发者提供,仅供信息参考和技术访问之用。cTrader Store 并非经纪商,不提供投资建议、个人推荐或任何未来业绩保证。
该作者的其他作品


价格
注册日期 14/02/2025
10
销售