
说明
带振荡器布林带的高级趋势动态
Squeeze Pro:动量与波动率套件 是一款适用于cTrader的机构级工具包。与标准指标不同,该套件提供了市场行为的双层分析:它识别挤压阶段(市场压缩)并通过直接在振荡器上计算的布林带监控动量极值。
主要创新
-
- 动量布林带: 首创。通过将布林带应用于动量柱状图,您可以识别“超买”或“超卖”的动量水平——非常适合在趋势耗尽前把握退出时机。
- 三态挤压检测:
-
- 黑点(挤压开启): 高度压缩。市场正在“盘绕”,准备迎来大突破。
- 灰点(挤压关闭): 波动率正在扩张。行情已经开始。
- 蓝点(无挤压): 正常市场状态。
- 线性回归平滑: 使用精炼的
CalculateLinearRegression算法过滤价格噪音,提供平滑且可靠的柱状图。 - 双重叠加逻辑: 在独立指标窗口中运行,保持价格图表整洁,同时提供深度分析洞察。
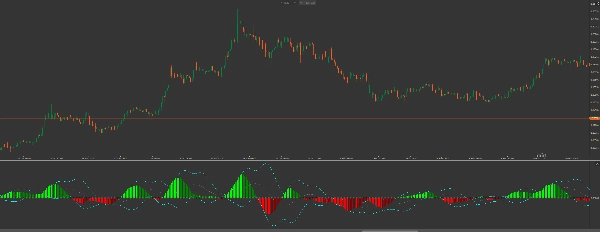
视觉智能指南:
-
- 柱状图(趋势与强度)
-
- 酸橙色: 多头动量加速(强劲买入)。
- 绿色: 多头动量放缓(获利了结)。
- 红色: 空头动量加速(强劲卖出)。
- 栗色: 空头动量放缓(卖方疲软)。
- 振荡器带(“青色”线)
-
- 当柱状图条突破 青色布林带 时,当前趋势处于统计极端。柱状图开始回撤回这些带内时,注意反转或重大回调。
交易策略:“强力突破”
-
- 识别挤压: 等待零线出现黑点。这表示“风暴前的宁静”。
- 确认方向: 寻找第一个酸橙色(买入)或红色(卖出)柱状图条。
- 触发点: 当出现挤压关闭(灰点)时入场,表示能量释放。
- 退出: 当柱状图由酸橙色变为绿色,或当柱状图达到振荡器上布林带时获利了结,表示耗尽。
为什么升级到Squeeze Pro?
基础指标显示价格去了哪里,而Squeeze Pro 显示了推动价格变动的压力。通过同时观察挤压和动量带,您可以避免进入已耗尽的趋势,捕捉到其他人错过的爆发性行情。
开发者备注: 该指标针对cTrader的API高度优化,即使在低端机器上也能实现零性能延迟,同时实时处理复杂的线性回归计算。
摘要
AI 摘要
Squeeze Pro Momentum is an advanced momentum and volatility indicator designed for the cTrader platform. It combines oscillator-based Bollinger Bands applied directly to a momentum histogram with a three-state squeeze detection system to analyze market compression and momentum extremes. The indicator identifies periods of low volatility ("Squeeze On" with black dots), expanding volatility signaling a breakout ("Squeeze Off" with gray dots), and normal market conditions ("No Squeeze" with blue dots).
Key features include linear regression smoothing to reduce price noise, a dual-overlay display that keeps the price chart uncluttered, and a color-coded histogram that visually represents bullish and bearish momentum strength and changes. When histogram bars move outside the oscillator’s Bollinger Bands (cyan lines), it signals statistically extreme momentum levels, useful for timing entries and exits.
The indicator supports a "Power Breakout" trading strategy: traders wait for squeeze signals, confirm momentum direction via histogram colors, enter trades on squeeze release, and exit when momentum shows signs of exhaustion. This suite provides institutional-grade insights into trend pressure and momentum dynamics, helping traders identify potential explosive moves and avoid exhausted trends.
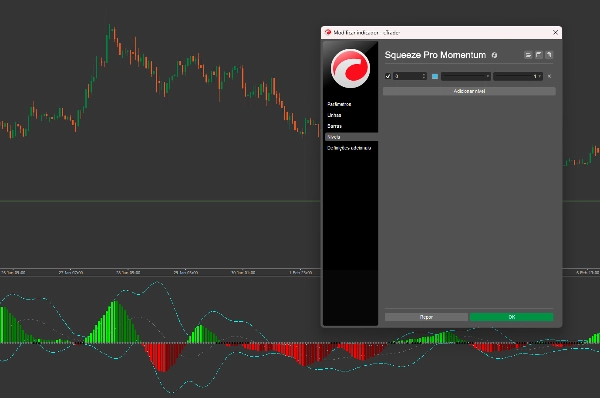
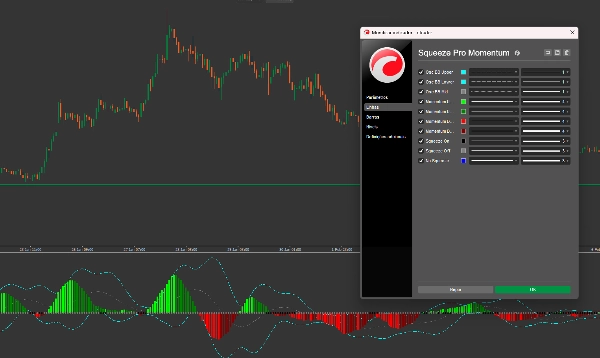
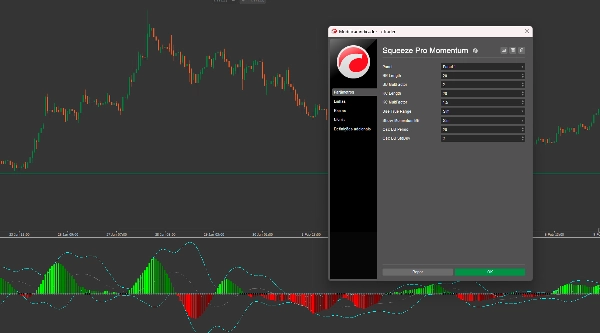
指标配置
指标分类
动量
输出类型
可视化
数据要求
仅 K 线
支持的信号
背离
交叉
反转
趋势强度
波动性
突破
客户评价
4.0
评价:3
5 | 0 % | |
4 | 100 % | |
3 | 0 % | |
2 | 0 % | |
1 | 0 % |
客户评价
May 10, 2026
a week of notes gives a better read. The decision gets a little more breathing room.
May 8, 2026
讨论
常见问答
Bollinger Bands
Keltner Channels
Volume
Channel
ATR
Moving Average
cTrader Store 提供的所有产品,包括交易机器人、指标和插件,均由第三方开发者提供,仅供信息参考和技术访问之用。cTrader Store 并非经纪商,不提供投资建议、个人推荐或任何未来业绩保证。
该作者的其他作品


价格
注册日期 14/02/2025
10
销售