
说明
机构支撑与阻力可视化工具
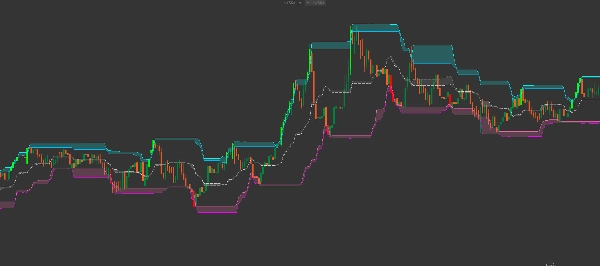
智能Donchian云反转 是一款新一代波动率通道,旨在识别高概率的反转区域。不同于仅跟踪最高高点和最低低点的标准Donchian通道,该指标分析了 蜡烛影线 与 蜡烛实体 之间的关系,以绘制“压力云”。
这些云层作为动态的供需区域,准确显示市场可能停滞或反转的位置。
先进的多云架构
该指标具有复杂的三层云系统:
-
- 阻力云(青色/蓝色): 位于顶部,显示最高影线与最高蜡烛实体之间的差距。这是“卖出区”。
- 均衡云(灰色/银色): 中央带,追踪市场的平衡。它代表影线与实体之间的公允价值中点。
- 支撑云(粉色/品红色): 位于底部,显示最低影线与最低蜡烛实体之间的差距。这是“买入区”。
关键交易特性
-
- ATR波动率过滤器: 包含内置的ATR(平均真实波幅)乘数,轻微偏移外部带,过滤市场噪音和“止损猎杀”。
- 智能蜡烛着色: 指标自动突出显示突破动能:
- 青柠色蜡烛: 价格已收于上方阻力云之上(看涨突破)。
- 红色蜡烛: 价格已收于下方支撑云之下(看跌突破)。
- 影线与实体逻辑: 通过观察“云”的厚度,可以判断波动性。厚云表示长影线(高拒绝/犹豫),薄云表示强劲、果断的价格动作。
如何使用智能Donchian云进行交易
1. 均值回归(剥头皮) » 寻找价格进入 阻力云 但未收于其上方。这通常表示“假突破”,提示高概率的空头入场,回归中线。
2. 趋势突破 » 当蜡烛变为 青柠色(收于上影线过滤器之上),表示多头已突破阻力区。这是趋势跟随策略的强烈信号。
3. 支撑反弹 » 关注 支撑云(粉色)。当价格在上升趋势回调时触及该区域,代表“价值买入”区,机构买家常在此介入。
技术参数
-
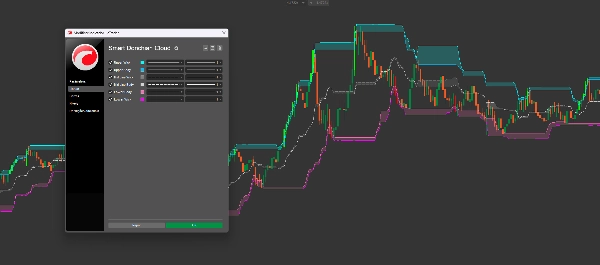
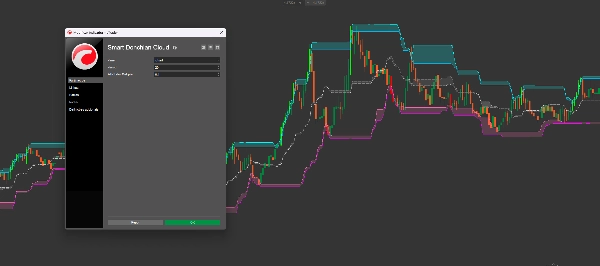
- 周期: 用于计算最高和最低的回溯周期(默认:20)。
- ATR过滤乘数: 调整极端值周围的“填充”,避免被小幅尖峰困扰。
- 完全可定制颜色: 可根据个人图表模板调整上云、中云和下云的颜色。
为何此工具不可或缺
大多数交易者失败,是因为他们将支撑和阻力视为单一线条。实际上,它们是 区域。 智能Donchian云反转 以数学方式映射这些区域,为您提供比任何传统通道指标更清晰的市场结构图景。
摘要
指标配置
指标分类
支撑与阻力
输出类型
可视化
过滤器
数据要求
仅 K 线
支持的信号
突破
反转
趋势强度
触及水平位
突破水平位
客户评价
5.0
评价:1
5 | 100 % | |
4 | 0 % | |
3 | 0 % | |
2 | 0 % | |
1 | 0 % |
讨论
常见问答
Premium/Discount
Donchian Channels
Market Structure
Supply & Demand
Channel
ATR
Support & Resistance
cTrader Store 提供的所有产品,包括交易机器人、指标和插件,均由第三方开发者提供,仅供信息参考和技术访问之用。cTrader Store 并非经纪商,不提供投资建议、个人推荐或任何未来业绩保证。
该作者的其他作品


!["High-Low Divergence [Iridio Capital]" 标识](https://cdn.ctrader.com/image/webp/443c4661-7abb-40f1-842f-4b6ec560649b_40914)


价格
注册日期 14/02/2025
10
销售