

说明
掌握市场波动而无图表杂乱
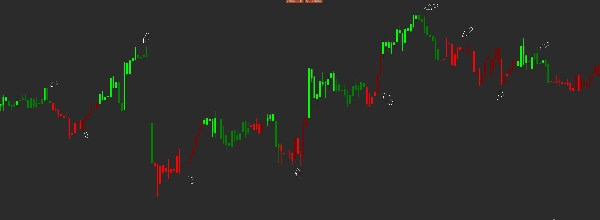
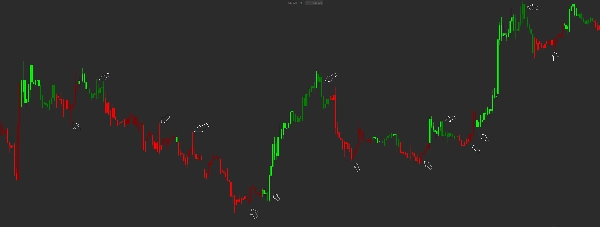
挤压动量蜡烛绘制器 是一个基于经典TTM挤压逻辑的复杂波动性和动量指标。它不是用振荡器填满你的屏幕,而是智能地为你的价格柱着色,让你能够识别 高概率爆发性走势 和趋势转变,同时保持你的主图表清晰且专业。
概述
市场在两种状态之间转换: 压缩(挤压) 和 扩张(波动性)。该指标利用布林带和凯尔特纳通道之间的关系来识别这些阶段,结合线性回归动量算法来确定趋势方向和强度。
主要特点
-
- 直观的颜色编码: 通过4种不同的蜡烛颜色即时识别趋势动量。
- TTM挤压算法: 内置价格压缩和动量斜率的计算。
- 简洁的用户界面设计: 免去了单独的直方图窗口,为价格行为分析提供更多空间。
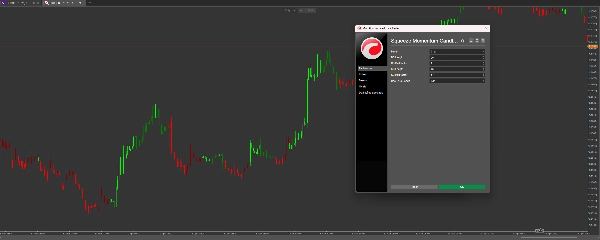
- 完全可定制: 调整布林带和凯尔特纳通道参数以适应任何时间框架或资产类别(外汇、指数或加密货币)。
- 零滞后逻辑: 使用线性回归比传统移动平均线更快地检测动量变化。
如何解读颜色:
-
- 酸橙色 » 强劲的上升动量(增强中)
- 绿色 » 减弱的上升动量(放缓中)
- 红色 » 强劲的下降动量(增强中)
- 栗色 » 减弱的下降动量(放缓中)
交易策略
积累阶段: 当动量较低(栗色或绿色)时,市场通常处于“挤压”或盘整状态。
突破阶段: 寻找从绿色转为酸橙色(看涨)或栗色转为红色(看跌)的转变。这表明动量正在加速。
退出阶段: 当酸橙色蜡烛变为绿色,或红色蜡烛变为栗色时,表示当前走势动力减弱——是获利了结或收紧止损的最佳时机。
为什么选择此指标?
大多数交易者失败是因为反应太晚。 挤压动量蜡烛绘制器可视化市场的“内部”能量。通过观察蜡烛颜色的变化,你获得心理优势,能更长时间持有盈利交易,并在反转来临前退出。
摘要
AI summary
The Squeeze Momentum Candle Painter is a volatility and momentum indicator that applies the TTM Squeeze logic directly to price bar coloring. It identifies market phases of compression (squeeze) and expansion (volatility) by analyzing the relationship between Bollinger Bands and Keltner Channels. A linear regression momentum algorithm determines trend direction and strength, enabling detection of momentum shifts with minimal lag.
Key features include intuitive color coding of candles into four states—strong upward momentum (lime), weakening upward momentum (green), strong downward momentum (red), and weakening downward momentum (maroon)—which visually represent trend momentum without cluttering the chart with oscillators or histograms. The indicator’s parameters for Bollinger Bands and Keltner Channels are fully customizable to suit various timeframes and asset classes such as Forex, indices, and cryptocurrencies.
Traders can interpret the color transitions to identify consolidation phases, breakout points, and momentum weakening, aiding in entry and exit decisions. This tool integrates volatility regime, trend strength, and reversal signals into a clean, easy-to-read visualization directly on price bars.
Key features include intuitive color coding of candles into four states—strong upward momentum (lime), weakening upward momentum (green), strong downward momentum (red), and weakening downward momentum (maroon)—which visually represent trend momentum without cluttering the chart with oscillators or histograms. The indicator’s parameters for Bollinger Bands and Keltner Channels are fully customizable to suit various timeframes and asset classes such as Forex, indices, and cryptocurrencies.
Traders can interpret the color transitions to identify consolidation phases, breakout points, and momentum weakening, aiding in entry and exit decisions. This tool integrates volatility regime, trend strength, and reversal signals into a clean, easy-to-read visualization directly on price bars.
指标配置
指标分类
波动性
输出类型
可视化
数据要求
仅 K 线
跳动点数据
交易量
支持的信号
趋势强度
波动性
反转
客户评价
5.0
评价:4
5 | 100 % | |
4 | 0 % | |
3 | 0 % | |
2 | 0 % | |
1 | 0 % |
客户评价
April 30, 2026
Ngl, market notes are quicker to compare and that is enough to keep testing it, and H1 makes the signal less noisy.
讨论
常见问答
Bollinger Bands
Keltner Channels
Channel
Moving Average
cTrader Store 提供的所有产品,包括交易机器人、指标和插件,均由第三方开发者提供,仅供信息参考和技术访问之用。cTrader Store 并非经纪商,不提供投资建议、个人推荐或任何未来业绩保证。


























价格
注册日期 14/02/2025
17
销售