present
Daftar dan dapatkan potongan bernilai $50 untuk pembelian pertama anda
Trading product for Tradingfcs_vwap Indikator VWAP Support & Resistance, image 2
Trading product for Tradingfcs_vwap Indikator VWAP Support & Resistance, image 3
Trading product for Tradingfcs_vwap Indikator VWAP Support & Resistance, image 4
Trading product for Tradingfcs_vwap Indikator VWAP Support & Resistance, image 5
Trading product for Tradingfcs_vwap Indikator VWAP Support & Resistance, image 6
Sejak 05/07/2026
38.9M
Volum yang didagangkan
327.09K
Pip dimenangi

Penerangan

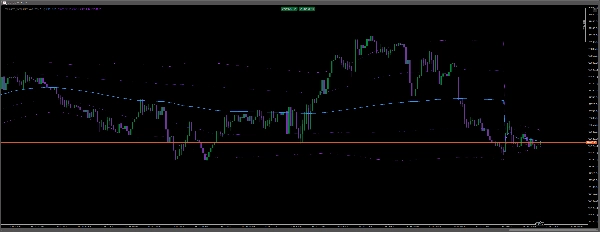
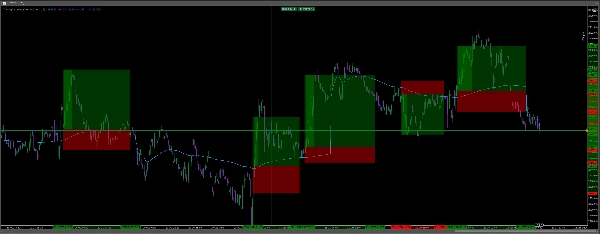
  • šŸ”µ Garis VWAP Biru: Mewakili harga dagangan purata berwajaran volum, membantu mengenal pasti arah pasaran intrahari dan sokongan atau rintangan dinamik.


  • 🟣 Pita Penyimpangan Ungu: Menonjolkan kawasan di mana harga telah bergerak jauh dari puratanya, membantu pedagang mengenal pasti potensi keterlaluan dan peluang pembalikan.


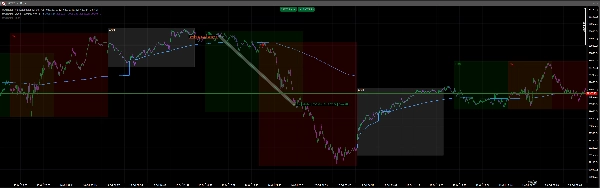
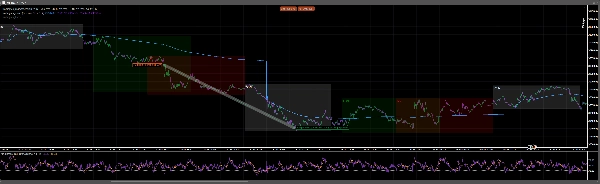
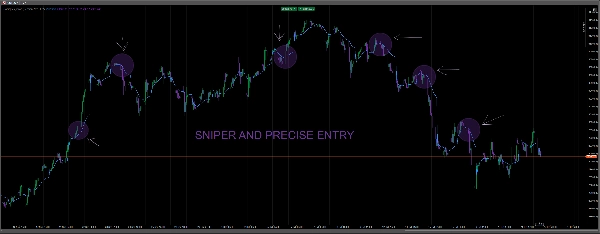
  • šŸ“ˆ Penolakan Harga: Carta H1 yang diserlahkan menggambarkan bagaimana reaksi harga di sekitar VWAP boleh mendahului pergerakan menaik atau menurun.


ā° Sesi Perdagangan: Lapisan sesi berasingan anda mengenal pasti tempoh perdagangan Asia, London, dan New York, membantu anda menilai peluang semasa keadaan pasaran yang berbeza.

----------------------------------


Bagaimana Ia Membantu Pedagang Mengenal Pasti Peluang

🟢 Peluang BELI: Apabila harga kekal di atas VWAP dan berjaya mengujinya semula sebagai sokongan, pedagang boleh mencari kesinambungan menaik.

šŸ”“ Peluang JUAL: Apabila harga berdagang di bawah VWAP dan menolaknya sebagai rintangan, pedagang boleh mengenal pasti potensi kesinambungan menurun.

⚔ Scalping Ketepatan: Pada jangka masa M1 dan M5, VWAP membantu pedagang mengenal pasti potensi kemasukan, penarikan balik, dan keluar menggunakan tindakan harga dan pengesahan momentum

Ringkasan

Ringkasan AI
Tradingfcs_vwap is a technical indicator designed to assist traders in identifying intraday market trends and potential trade entries using the Volume Weighted Average Price (VWAP). It features a blue VWAP line that reflects the average trading price weighted by volume, serving as a dynamic support or resistance level. Purple deviation bands highlight price movements away from the VWAP, indicating possible overextensions and reversal points.

The indicator also visualizes price rejections on the hourly chart, showing how price interactions with the VWAP can signal bullish or bearish moves. Separate overlays mark the Asian, London, and New York trading sessions, enabling traders to assess market behavior across different periods.

Key trading signals include:
- Buy opportunities when price holds above VWAP and retests it as support.
- Sell opportunities when price trades below VWAP and rejects it as resistance.
- Precision scalping on 1- and 5-minute timeframes by identifying entries, pullbacks, and exits through price action and momentum confirmation.

This tool supports analysis based on volume, support and resistance, and trend strength, using bar data inputs and providing signal outputs for enhanced decision-making in various trading styles.
Profil indikator
Kategori indikator
Sokongan & rintangan
Jenis output
Isyarat
Keperluan data
Bar sahaja
Isyarat yang disokong
Kekuatan trend

Perbincangan

Ulasan pelanggan

4.0
Ulasan: 1
5
0 %
4
100 %
3
0 %
2
0 %
1
0 %
Ulasan pelanggan
October 22, 2026
VWAP and deviation bands give the H1 rejection examples a clear reference. Session overlays add timing, and the description distinguishes holding above the average from rejecting below it. A useful context view rather than one mechanical rule for every band touch.

Soalan Lazim

VWAP
Support & Resistance
Produk yang tersedia melalui cTrader Store, termasuk bot dagangan, indikator dan plugin, disediakan oleh pembangun pihak ketiga dan diberikan akses untuk tujuan maklumat dan teknikal sahaja. cTrader Store bukan broker dan tidak memberikan nasihat pelaburan, syor peribadi atau sebarang jaminan prestasi masa hadapan.

Anda juga mungkin suka

Indikator
ATR
EMA
+5
Signals when a burst beyond its ATR band stalls, rated 0-10, with liquidity clusters, session ranges and a full webhook
Indikator
Master RSI reversals with Parabolic SAR precision! Get real-time alerts for high-probability trend changes.
Indikator
ATR
Prop
+13
Enhance trading with ATR Bands! Visualize market volatility using dynamic upper and lower ATR bands for precise decision
Indikator
ATR
Volume
+3
Volume profile key levels - POC, value area, volume peaks and troughs - with break, rejection and retest signals
Indikator
Key Levels
Trend-filtered signals, transparent trade plans and a multi-timeframe decision panel for cTrader.
Indikator
Key Levels
Liquidity Grab
+2
The levels you mark each morning, drawn and followed: PDH/PDL, weekly, monthly, sessions, equal highs/lows.
Indikator
ATR
RSI
+4
Adaptive Ichimoku with nine-factor confluence scoring, five signal types, smart TP/SL and an MTF panel.
Indikator
ATR
VWAP
+2
Swing anchor VWAP pullback signals, each with entry, stop and three targets drawn, seven filter profiles and auto pick
Indikator
Forex
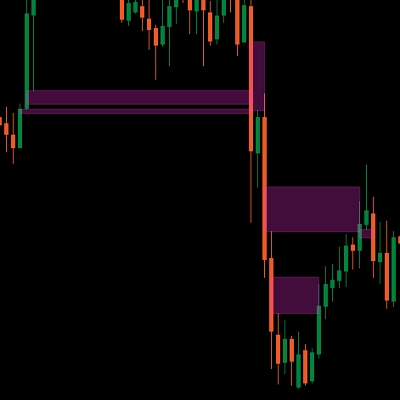
Detects valid Fair Value Gaps from strong 3-bar patterns. Keep drawing unfilled gaps until price fills them.
Indikator
Laguerre RSI: smoother, faster RSI with less noise. Great for spotting reversals and timing entries.
Indikator
ATR
Forex
+5
A powerful ATR-based indicator generating clear BUY/SELL signals. Features real-time alerts and customizable sensitivity
Indikator
SMC
VWAP
+4
Killzone Session and key levels with VWAP – Precision Meets Price Action
Indikator
ADX
ATR
+5
Six momentum readings blended into one score, with filtered signals, trade levels, a live dashboard and a full webhook
Indikator
Prop
Forex
+12
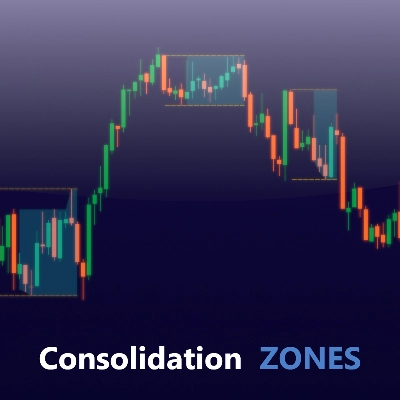
Identify and trade breakouts with Consolidation Zones! Visualize price consolidation areas for trading opportunities.
Indikator
AI
SMC
+11
Perfect Entry Price designed to help traders identify the most accurate and reliable price levels for market entries
Indikator
Volume
Imbalance
+1
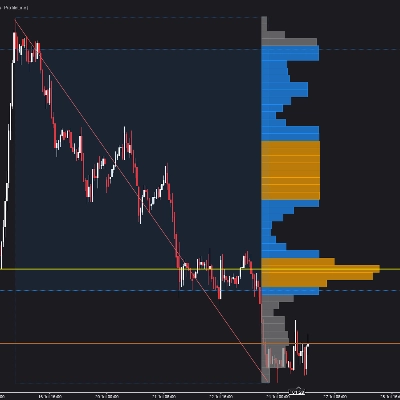
Volume profile indicator that auto-detects the latest trendline. Shows POC, Value Area (VAH/VAL), and High Volume Nodes
Indikator
SMC
Forex
+15
Smart institutional order block & FVG scanner with alerts, zone merging, and HTF confluence.
Indikator
RSI
MACD
Unlock market insights with our Multi-Timeframe Market Levels indicator, enhancing your trading strategies effortlessly

Harga

Sejak 05/07/2026
38.9M
Volum yang didagangkan
327.09K
Pip dimenangi