
Descrizione
Rivoluziona la tua analisi dei grafici
Entra nel futuro dell'analisi tecnica con Delta-RSI Candle Pro – l'indicatore innovativo che trasforma le candele ordinarie in potenti visualizzatori di momentum. Perché ingombrare lo schermo con più indicatori quando puoi avere tutto ciò di cui hai bisogno direttamente sulle candele?
La soluzione visiva di trading tutto-in-uno
-
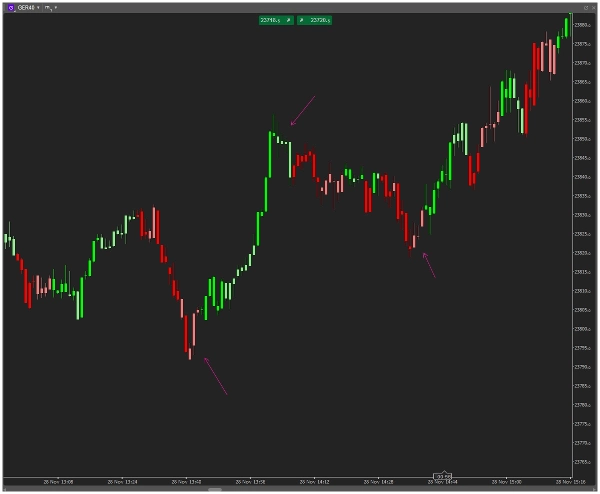
- Riconoscimento immediato del segnale: Forza e direzione del momentum visualizzate intuitivamente tramite il colore
- Massimizza lo spazio sullo schermo: Elimina per sempre i pannelli separati degli oscillatori
- Precisione matematica: La regressione polinomiale avanzata calcola il vero momentum RSI
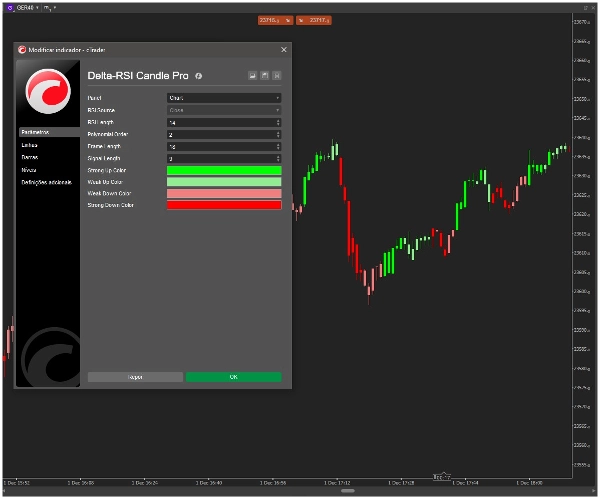
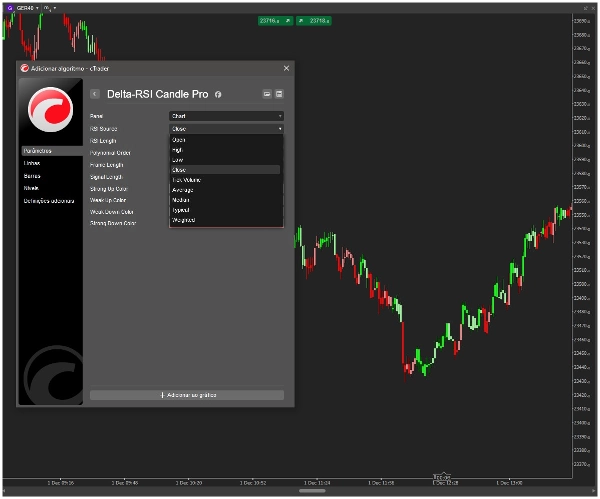
- Personalizzazione completa: Usa i selettori di colore nativi di cTrader per adattarti al tuo stile di trading
- Affidabile e preciso: Calcoli non repaint basati su dati di prezzo confermati
Come funziona Delta-RSI Candle Pro
Il nostro algoritmo proprietario calcola la derivata istantanea del RSI utilizzando l'adattamento di curve polinomiali, quindi assegna colori intelligenti a ogni candela:
-
- Forte rialzista: Verde intenso – Momentum positivo in accelerazione
- Debole rialzista: Verde chiaro – Momentum positivo ma con cautela
- Debole ribassista: Rosso chiaro – Momentum negativo ma possibile inversione
- Forte ribassista: Rosso scuro – Momentum negativo in accelerazione
Caratteristiche chiave che ci distinguono
-
- 🎯 Integrazione diretta sulle candele: I colori appaiono direttamente sulle tue candele di trading
- 🎨 Selezione visiva dei colori: Selettori di colore intuitivi di cTrader – nessun nome di codice necessario
- ⚙️ Completamente regolabile: Regola lunghezza RSI, ordine polinomiale e periodo di lookback
- 🚀 Prestazioni ottimizzate: Motore di calcolo leggero per un funzionamento fluido
- 📊 Algoritmo di livello professionale: Analisi matematica della derivata per segnali superiori
Chi ne beneficia di più?
-
- Trader giornalieri che necessitano di segnali visivi istantanei di momentum
- Trader swing che identificano precocemente i cambi di trend
- Trader minimalisti che odiano l'ingombro del grafico
- Trader algoritmici che cercano conferme visive
- Tutti i trader seri che vogliono un vantaggio nell'analisi di mercato
Inizia in pochi secondi
-
- Aggiungi Delta-RSI Candle Pro al tuo grafico
- Seleziona i tuoi colori preferiti usando i selettori visivi
- Regola i parametri per adattarli al tuo timeframe di trading
- Vedi immediatamente emergere i pattern di momentum sulle tue candele
Eccellenza tecnica
-
- Tipo indicatore overlay (nessun pannello separato)
- Algoritmo non repaint
- Calcolo della derivata polinomiale del RSI
- Compatibile con tutti i simboli e timeframe
- Aggiornamenti e miglioramenti regolari
Perché questo è diverso
Mentre altri indicatori aggiungono complessità, Delta-RSI Candle Pro semplifica e migliora. Abbiamo preso l'analisi matematica avanzata del momentum e l'abbiamo resa visivamente intuitiva. Non più dividere l'attenzione tra prezzo e indicatori – ora lavorano insieme come un sistema coeso.
Pronto a vedere i tuoi grafici in un modo rivoluzionario?...
Riepilogo
Key features include immediate visual signal recognition through candle coloring, elimination of separate oscillator panels to maximize chart space, and advanced mathematical precision with non-repainting calculations based on confirmed price data. Users can fully customize colors and parameters such as RSI length, polynomial order, and lookback period using cTrader’s native color pickers.
Delta-RSI Candle Pro is compatible with all symbols and timeframes and is optimized for smooth performance with a lightweight calculation engine. It is suitable for day traders, swing traders, minimalist traders, algorithmic traders, and others seeking clear, integrated momentum analysis without chart clutter. The indicator overlays directly on price candles, providing a cohesive system that combines price and momentum information visually.
Recensioni dei clienti
5 | 100 % | |
4 | 0 % | |
3 | 0 % | |
2 | 0 % | |
1 | 0 % |


![Logo di "[CB] Pivot Points Pro"](https://cdn.ctrader.com/image/webp/43463c82-67b0-4f10-a4ba-901bba091d81_32594)

