

present
Registrati e ricevi uno sconto da $50 sul tuo primo acquisto
Trading product for Squeeze Momentum Candle Painter Indicatore Bollinger Bands Keltner Channels, image 1
Squeeze Momentum Candle Painter
Indicatore
Versione 1.0, Apr 2026
Windows, Mac
5.0
Recensioni: 4
Trading product for Squeeze Momentum Candle Painter Indicatore Bollinger Bands Keltner Channels, image 2
Trading product for Squeeze Momentum Candle Painter Indicatore Bollinger Bands Keltner Channels, image 3
Trading product for Squeeze Momentum Candle Painter Indicatore Bollinger Bands Keltner Channels, image 4
Da 14/02/2025
14
Vendite

Descrizione

Domina la volatilità del mercato senza ingombro di grafici

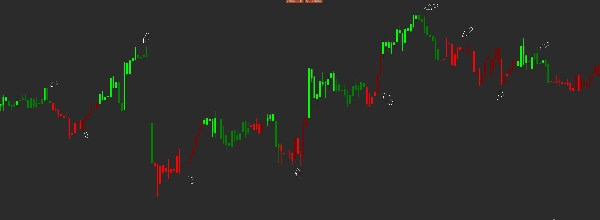
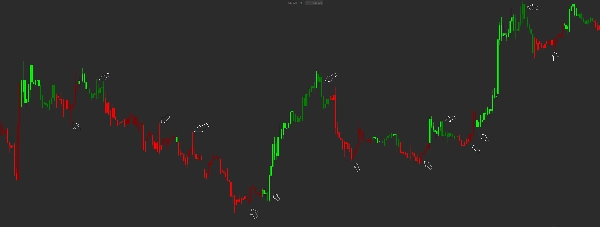
Il Squeeze Momentum Candle Painter è un indicatore sofisticato di volatilità e momentum basato sulla logica classica del TTM Squeeze. Invece di riempire lo schermo con oscillatori, questo strumento colora intelligentemente le barre dei prezzi, permettendoti di identificare movimenti esplosivi ad alta probabilità e cambi di tendenza mantenendo il grafico principale pulito e professionale.


Panoramica

Il mercato transita tra due stati: Compressione (Squeeze) e Espansione (Volatilità). Questo indicatore utilizza la relazione tra le Bande di Bollinger e i Canali di Keltner per identificare queste fasi, combinata con un algoritmo di momentum basato sulla Regressione Lineare per determinare la direzione e la forza della tendenza.


Caratteristiche principali

    • Codifica colore intuitiva: Riconosci istantaneamente il momentum della tendenza attraverso 4 colori distinti delle candele.
    • Algoritmo TTM Squeeze: Calcolo integrato della compressione del prezzo e della pendenza del momentum.
    • Design UI pulito: Elimina la necessità di una finestra istogramma separata, offrendo più spazio per l'analisi dell'azione del prezzo.
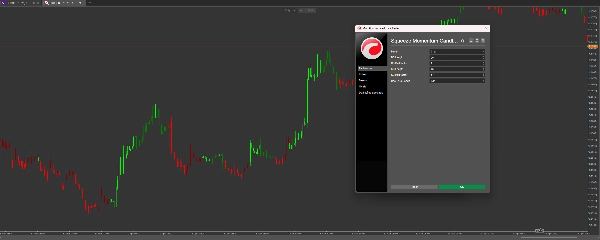
    • Completamente personalizzabile: Regola i parametri delle Bande di Bollinger e dei Canali di Keltner per adattarsi a qualsiasi timeframe o classe di asset (Forex, Indici o Crypto).
    • Logica a zero ritardo: Usa la regressione lineare per rilevare i cambiamenti di momentum più rapidamente rispetto alle medie mobili tradizionali.


Come leggere i colori :

    • Lime » Forte momentum al rialzo (in aumento)
    • Verde » Momentum al rialzo in indebolimento (rallentamento)
    • Rosso » Forte momentum al ribasso (in aumento)
    • Marrone scuro » Momentum al ribasso in indebolimento (rallentamento)


La strategia di trading

La preparazione: Quando il momentum è basso (Marrone scuro o Verde), il mercato spesso si "stringe" o consolida.
La rottura: Cerca una transizione da Verde a Lime (rialzista) o da Marrone scuro a Rosso (ribassista). Questo indica che il momentum sta accelerando.
L'uscita: Quando una candela Lime diventa Verde, o una candela Rossa diventa Marrone scuro, segnala che il movimento attuale sta perdendo forza—un momento perfetto per prendere profitti o stringere gli Stop Loss.


Perché scegliere questo indicatore?

La maggior parte dei trader fallisce perché reagisce troppo tardi. Il Squeeze Momentum Candle Painter visualizza l'energia "interna" del mercato. Osservando il cambiamento dei colori delle candele, ottieni un vantaggio psicologico, rimanendo più a lungo nelle operazioni vincenti ed uscendo prima che avvenga il ribaltamento.

Riepilogo

Riepilogo AI
The Squeeze Momentum Candle Painter is a volatility and momentum indicator that applies the TTM Squeeze logic directly to price bar coloring. It identifies market phases of compression (squeeze) and expansion (volatility) by analyzing the relationship between Bollinger Bands and Keltner Channels. A linear regression momentum algorithm determines trend direction and strength, enabling detection of momentum shifts with minimal lag.

Key features include intuitive color coding of candles into four states—strong upward momentum (lime), weakening upward momentum (green), strong downward momentum (red), and weakening downward momentum (maroon)—which visually represent trend momentum without cluttering the chart with oscillators or histograms. The indicator’s parameters for Bollinger Bands and Keltner Channels are fully customizable to suit various timeframes and asset classes such as Forex, indices, and cryptocurrencies.

Traders can interpret the color transitions to identify consolidation phases, breakout points, and momentum weakening, aiding in entry and exit decisions. This tool integrates volatility regime, trend strength, and reversal signals into a clean, easy-to-read visualization directly on price bars.
Profilo indicatore
Categoria indicatore
Volatilità
Tipo di output
Visualizzazione
Requisiti per i dati
Solo barre
Dati sui tick
Volume
Segnali supportati
Forza del trend
Volatilità
Inversione

Recensioni dei clienti

5.0
Recensioni: 4
5
100 %
4
0 %
3
0 %
2
0 %
1
0 %
Recensioni dei clienti
May 7, 2026
Good helper vibe, not a full system vibe. Risk cannot be ignored.
May 5, 2026
The trade log stays cleaner, but risk cannot be ignored.
May 3, 2026
Tested small first and that felt like the right move.
April 30, 2026
Ngl, market notes are quicker to compare and that is enough to keep testing it, and H1 makes the signal less noisy.

Discussioni

Domande frequenti

Bollinger Bands
Keltner Channels
Channel
Moving Average
I prodotti disponibili tramite cTrader Store, inclusi bot di trading, indicatori e plugin, sono forniti da sviluppatori terzi e resi disponibili esclusivamente a scopo informativo e di accesso tecnico. cTrader Store non è un broker e non fornisce consulenze in materia di investimento, raccomandazioni individualizzate o garanzie di risultati futuri.

Altro da questo autore

Indicatore
ATR
Key Levels
It combines the trend-filtering power of Renko charts with the volatility tracking of ATR Bands
Indicatore
ATR
RSI
+5
Delta RSI Candle Pro, the indicator that transforms ordinary candlesticks into powerful momentum visualizers.
Indicatore
ATR
SMC
+5
Candles Volume Delta is a powerful, visually intuitive indicator that transforms raw tick volume into actionable trading
Indicatore
Volume
Order Block
+1
Elevate your market analysis with the Aggression Delta Volume Profile, a premium, institutional-grade order flow utility
Logo di "Vwap Bands"
Più votato
4.5
(4)
$19
/
$29
Indicatore
VWAP
Moving Average
Vwap Bands it is highly sought after by professional traders because it includes Standard Deviation Bands
Indicatore
ATR
Volume
+4
This allows traders to see not just the trend, but whether the momentum itself is overextended.
Indicatore
ATR
VWAP
+2
Volume-Weighted Trend System that combines VWMA with ATR for volatility filtering.
Indicatore
ATR
Channel
+5
This fifth indicator is highly visual and focused on Supply and Demand zones

Potrebbe interessarti anche

Indicatore
Forex
BTCUSD
+5
Trend analysis, automatic analysis, position, swingtrader, scalper
Indicatore
ATR
SMC
+5
Candles Volume Delta is a powerful, visually intuitive indicator that transforms raw tick volume into actionable trading
Logo di "UT Bot"
Popolare
4.4
(5)
$19
/
$20
Indicatore
ATR
Forex
+11
Trend-following indicator with dynamic ATR-based trailing stop for precise entry/exit signals
Indicatore
AI
ATR
+9
Index Hunter: Momentum analysis for US30 & NAS100. Designed to identify high-velocity moves and intraday trends.
Indicatore
Forex
Crypto
+6
The ultimate candlestick suite is here to help you detect most of the candlestick patters that exist today.
Indicatore
SMC
Prop
+14
BoS ChoCH Pro,Strict Mode,False Breakout Filter,Average hit rate: 72-78%
Indicatore
AI
ATR
+27
An advanced VWAP with multi-VWAP (Daily/Weekly/Monthly/Anchored), click-to-anchor, configurable alerts, a stats panel,
Indicatore
RSI
XAUUSD
+2
Automatic ZigZag swings with dynamic support & resistance levels, labeling highs/lows for clear trend signals.
Indicatore
Volume
Key Levels
+2
Support and resistance from a rolling volume profile, ranked by strength or recency, updated live.
Indicatore
RSI
Signal
+1
🚀📈 Plot buy/sell signals on Range Bars using Moving Averages and RSI. Clear, actionable trading insights.🚀📈
Indicatore
SMC
NAS100
+5
Rolling Volume Profile MTF with 24H, 7D, 30D profiles and a precise NY Open marker.
Indicatore
BOS
Key Levels
+1
Guided by Yahuah Yahusha. 15M: BOS above red (buys)/below green (sells). 4HC reject+BOS. 5M: RBS/SBR. SL wick. TP 1:4.
Indicatore
ATR
SMC
+2
HTF POWER 3 ICT Power of 3 · M1 Precision · H4 Intelligence Auto-detect Accumulation → Manipulation → Distribution
Indicatore
MSS
Key Levels
+2
Fractal based market structure indicator that identifies HH, HL, LH, and LL pivot with confirmed, non-repainting fractal
Indicatore
BOS
Order Block
+3
Not every order block deserves your attention.
Indicatore
RSI
Breakout
+1
"Identify key market zones and visualize support/resistance from multiple timeframes on a single chart.
Indicatore
Support & Resistance
Detects Gartley, Bat, Butterfly, Crab, Shark & Cypher patterns and backtests each one's real win rate.
Indicatore
BOS
MSS
+3
Orderblocks with Multi-Timeframe.

Prezzo

Da 14/02/2025
14
Vendite

























