
Descrizione
Visualizzatore di Supporto e Resistenza Istituzionale
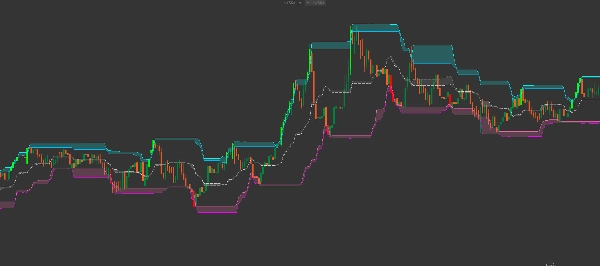
Il Smart Donchian Cloud Reversal è un canale di volatilità di nuova generazione progettato per identificare zone di inversione ad alta probabilità. A differenza dei canali Donchian standard che tracciano solo i massimi più alti e i minimi più bassi, questo indicatore analizza la relazione tra le ombre delle candele e i corpi delle candele per tracciare le "Nuvole di Pressione".
Queste nuvole agiscono come zone dinamiche di Offerta e Domanda, mostrando esattamente dove il mercato è probabile che si fermi o si inverta.
Architettura Avanzata Multi-Nuvole
Questo indicatore presenta un sofisticato sistema a 3 livelli di nuvole:
-
- La Nuvola di Resistenza (Ciano/Blu): Situata in alto, visualizza il divario tra l'ombra più alta e il corpo della candela più alto. Questa è la "Zona di Vendita".
- La Nuvola di Equilibrio (Grigio/Argento): Una fascia centrale che traccia l'equilibrio del mercato. Rappresenta il valore equo a metà strada tra ombre e corpi.
- La Nuvola di Supporto (Rosa/Magenta): Situata in basso, visualizza il divario tra l'ombra più bassa e il corpo della candela più basso. Questa è la "Zona di Acquisto".
Caratteristiche Chiave per il Trading
-
- Filtro di Volatilità ATR: Include un moltiplicatore ATR (Average True Range) integrato per spostare leggermente le bande esterne, filtrando il rumore di mercato e le "caccia agli stop".
- Colorazione Intelligente delle Candele: L'indicatore evidenzia automaticamente il momentum di breakout:
- Candele LIME: Il prezzo ha chiuso sopra la Nuvola di Resistenza Superiore (Breakout Rialzista).
- Candele ROSSE: Il prezzo ha chiuso sotto la Nuvola di Supporto Inferiore (Breakout Ribassista).
- Logica Ombra vs Corpo: Osservando lo spessore della "nuvola", puoi valutare la volatilità. Una nuvola spessa significa ombre lunghe (alta rifiuto/indecisione), mentre una nuvola sottile indica un'azione di prezzo forte e decisa.
Come Fare Trading con le Nuvole Donchian Intelligenti
1. La Reversione alla Media (Scalping) » Cerca che il prezzo entri nella Nuvola di Resistenza senza chiudere sopra di essa. Questo spesso indica un "falso segnale", segnalando un ingresso short ad alta probabilità verso la Linea Centrale.
2. Il Breakout di Trend » Quando una candela diventa Lime (chiudendo sopra il filtro dell'ombra superiore), segnala che i rialzisti hanno superato la zona di resistenza. Questo è un segnale potente per strategie di trend-following.
3. Il Rimbalzo dal Supporto » Osserva la Nuvola di Supporto (Rosa). Quando il prezzo tocca questa zona durante un ritracciamento in un trend rialzista, rappresenta un'area di "Acquisto di Valore" dove spesso intervengono acquirenti istituzionali.
Parametri Tecnici
-
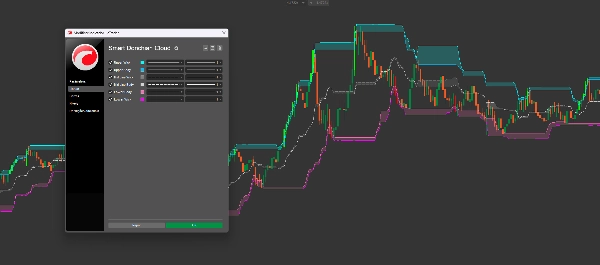
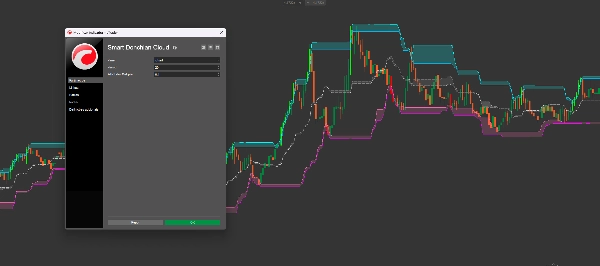
- Periodo: Il periodo di lookback per calcolare massimi e minimi (Predefinito: 20).
- Moltiplicatore Filtro ATR: Regola il "padding" intorno agli estremi per evitare di essere catturati da picchi minori.
- Colori Completamente Personalizzabili: Adatta le nuvole Superiore, Centrale e Inferiore per adattarle al tuo template personale del grafico.
Perché Questo Strumento è Essenziale
La maggior parte dei trader fallisce perché tratta Supporto e Resistenza come linee singole. In realtà, sono Zone. Lo Smart Donchian Cloud Reversal mappa queste zone matematicamente, offrendoti un'immagine più chiara della struttura del mercato rispetto a qualsiasi indicatore di canale tradizionale.
Riepilogo
Recensioni dei clienti
5 | 100 % | |
4 | 0 % | |
3 | 0 % | |
2 | 0 % | |
1 | 0 % |


