
Opis
Odkryj głębsze zrozumienie dynamiki rynku Forex dzięki kompleksowemu wskaźnikowi Relative Currency Strength (RCS), specjalnie zaprojektowanemu dla platformy cTrader.
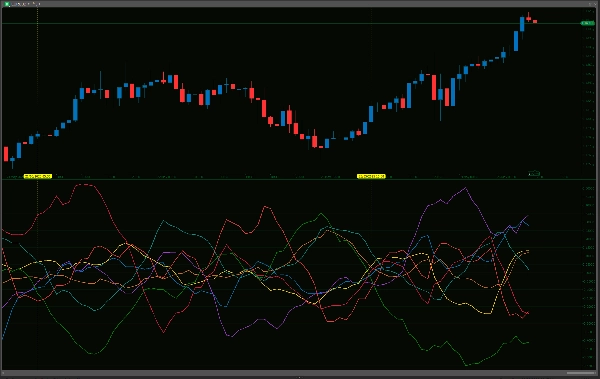
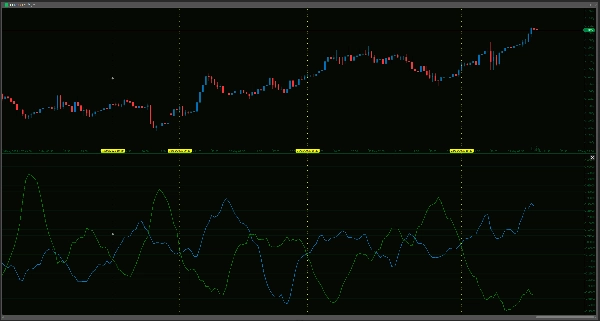
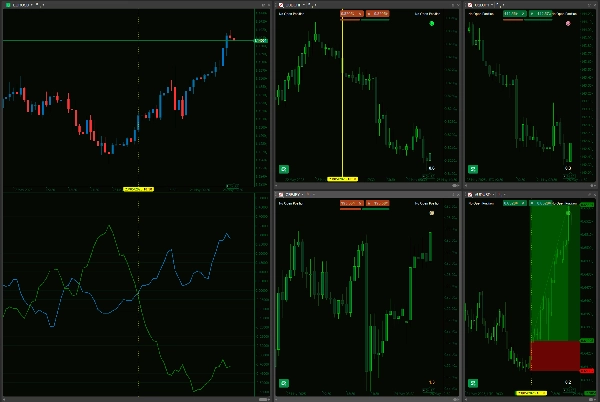
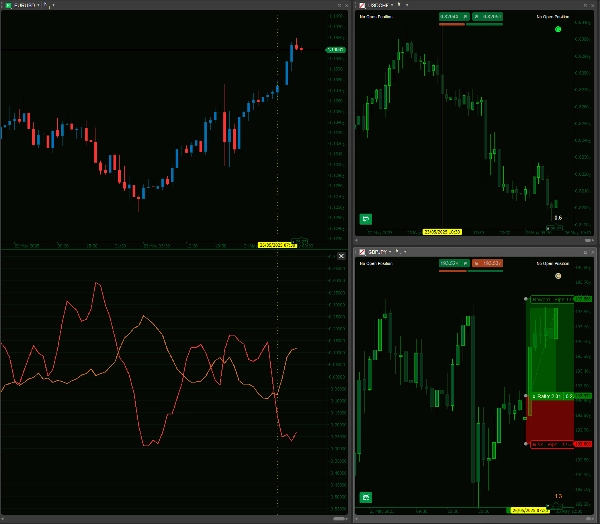
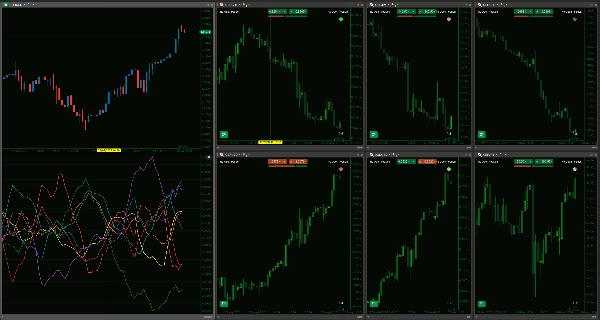
To potężne narzędzie skrupulatnie ocenia indywidualną wydajność ośmiu głównych walut — AUD, USD, EUR, JPY, GBP, CAD, CHF i NZD — analizując ich procentową zmianę względem siebie w koszyku 28 par walutowych. Dzięki definiowanym przez użytkownika okresom cofania i wygładzania możesz dostosować czułość wskaźnika do swojego unikalnego podejścia handlowego, od szybkiego skalpowania po strategie długoterminowe. Jasny wizualny wynik pozwala na natychmiastowe, szybkie porównanie, pomagając szybko zidentyfikować waluty wykazujące silny wzrostowy impet lub te, które pokazują oznaki słabości, co może być kluczowe przy wyborze par walutowych o wyższym potencjale dla Twoich strategii. Oferuje sposób wyjścia poza analizę pojedynczych par i zobaczenia szerszego obrazu, które indywidualne waluty naprawdę napędzają ruchy rynku.
Jednakże niezwykle ważne jest korzystanie z tego wskaźnika z jasnym zrozumieniem jego możliwości i ograniczeń. Wskaźnik RCS to zaawansowane narzędzie analityczne, a nie nieomylne urządzenie prognostyczne ani kompletny system handlowy „ustaw i zapomnij”. Jego obliczenia opierają się na historycznych danych cenowych i mają na celu uzupełnienie, a nie zastąpienie Twojej ustalonej metodologii handlowej, która powinna zawsze obejmować dokładną analizę ruchu cen, uwzględnienie czynników fundamentalnych oraz solidne praktyki zarządzania ryzykiem. Chociaż linie podkreślają „siłę” lub „słabość”, odczyty te wymagają ostrożnej interpretacji w szerszym kontekście rynkowym; na przykład waluta wykazująca ekstremalną „siłę” może zbliżać się do stanu wykupienia lub kluczowego poziomu oporu.
Wydajność wskaźnika może również wahać się w zależności od panujących warunków rynkowych (np. może zachowywać się inaczej na rynkach silnie trendujących w porównaniu do bocznych, niestabilnych), a jego dokładność zależy od tego, czy Twoja platforma posiada wystarczające, czyste dane historyczne dla wszystkich 28 par walutowych objętych analizą. Chociaż zoptymalizowany do ciągłych obliczeń, początkowe ładowanie danych dla tak kompleksowej analizy międzywalutowej może być wymagające dla zasobów platformy, zwłaszcza przy wolniejszych połączeniach lub mniej wydajnym sprzęcie. Dostarczając zniuansowaną, wielowalutową perspektywę, wskaźnik RCS jest oferowany jako cenne wsparcie pomagające podejmować bardziej świadome, strategicznie uzasadnione decyzje handlowe i potencjalnie zwiększyć Twoją przewagę na konkurencyjnym rynku Forex, a nie jako samodzielne rozwiązanie.
Proszę upewnij się, że Twój broker oferuje wszystkie pary krzyżowe zawarte w tym wskaźniku, aby mógł on działać poprawnie.
--------------------------
Zapraszam również do zapoznania się z moimi innymi wskaźnikami!
https://ctrader.com/products/1181
https://ctrader.com/products/1182
https://ctrader.com/products/1180
https://ctrader.com/products/1015
https://ctrader.com/products/555
https://ctrader.com/products/553
https://ctrader.com/products/554
https://ctrader.com/products/552
https://ctrader.com/products/557
https://ctrader.com/products/845
https://ctrader.com/products/848
https://ctrader.com/products/847
https://ctrader.com/products/846
https://ctrader.com/products/551
https://ctrader.com/products/574
https://ctrader.com/products/573
https://ctrader.com/products/556
https://ctrader.com/products/558
https://ctrader.com/products/559
https://ctrader.com/products/560
Podsumowanie
The indicator provides a clear visual representation of currency strength and weakness, enabling traders to identify currencies with strong momentum or signs of weakness at a glance. This multi-currency perspective helps move beyond single-pair analysis to understand which currencies are driving market movements.
The tool relies on historical price data and requires all relevant currency pairs to be available from the broker. Its performance may vary with market conditions, and it is intended to complement, not replace, comprehensive trading strategies that include price action, fundamental analysis, and risk management. Initial data loading can be resource-intensive due to the breadth of cross-currency calculations.
This indicator serves as an analytical aid to support more informed Forex trading decisions by highlighting relative currency strength across major pairs.
Opinie klientów
5 | 33 % | |
4 | 67 % | |
3 | 0 % | |
2 | 0 % | |
1 | 0 % |


