present
Registrieren Sie sich und erhalten Sie $50 Rabatt auf Ihren ersten Kauf
Trading product for Impulse Heatmap Indikator EMA Key Levels, image 1
Impulse Heatmap
Indikator
Version 1.0, Aug 2026
Windows, Mac
Trading product for Impulse Heatmap Indikator EMA Key Levels, image 2
Trading product for Impulse Heatmap Indikator EMA Key Levels, image 3
Trading product for Impulse Heatmap Indikator EMA Key Levels, image 4
Trading product for Impulse Heatmap Indikator EMA Key Levels, image 5
Seit 07/05/2026
5
Verkäufe
63
Kostenlose Installationen

Beschreibung

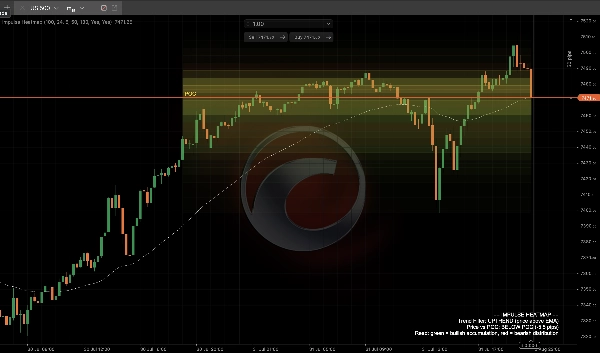
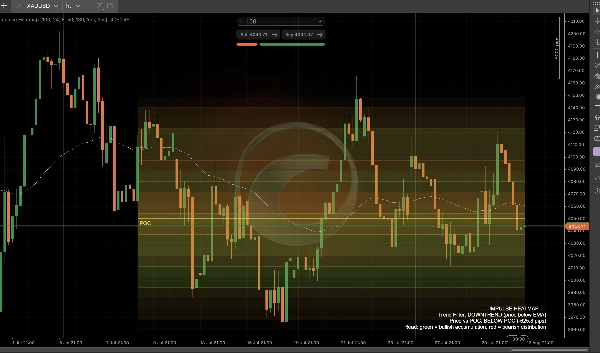
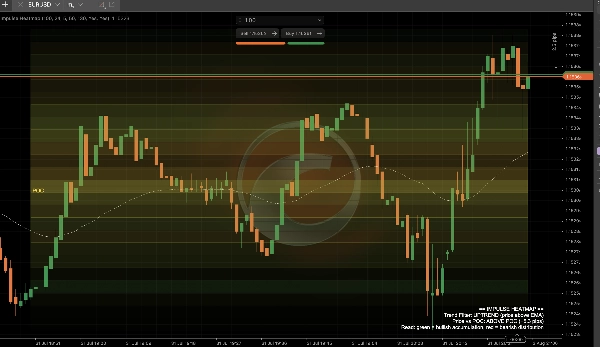
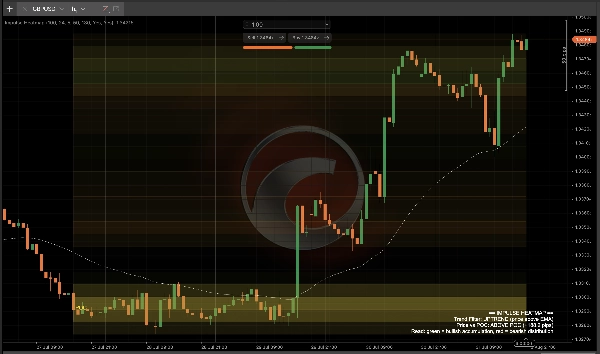
Volumen-Heatmaps sind gerade überall zu finden, aber fast alle zeigen dasselbe: nur Intensität, eine Farbe, kein Hinweis darauf, ob dieses Volumen Kauf- oder Verkaufsvolumen war. Impulse Heatmap fügt das fehlende Element hinzu — jede Preiszone wird farblich nach Richtung und nicht nur nach Dichte gemischt, sodass Sie auf einen Blick Akkumulation von Distribution unterscheiden können.

Was es analysiert: Tick-Volumen über ein rollierendes Rückblickfenster, verteilt auf Preisbereiche, ähnlich wie ein Standard-Volumenprofil funktioniert — außer dass die Farbe jedes Bereichs eine Mischung aus dem Anteil des Volumens ist, das von bullisch schließenden Kerzen gegenüber bärisch schließenden Kerzen bei diesem Preis stammt. Eine Zone mit überwiegend bullischem Volumen leuchtet grün (Akkumulation); eine Zone mit überwiegend bärischem Volumen leuchtet rot (Distribution); gemischte Zonen liegen irgendwo dazwischen.

Wie man es liest:

  • Helle, gesättigte Zonen = hohe Volumenkonzentration — dies sind die Preisniveaus, auf denen der Markt die meiste Zeit und das meiste Volumen verbracht hat.
  • Grünlich getönte Zonen = dieses Preisniveau wurde hauptsächlich durch bullischen Druck aufgebaut — ein potenzieller Unterstützungs-/Akkumulationsbereich.
  • Rötlich getönte Zonen = dieses Preisniveau wurde hauptsächlich durch bärischen Druck aufgebaut — ein potenzieller Widerstands-/Distributionsbereich.
  • Die goldene POC-Linie verfolgt das geglättete Schwerkraftzentrum des Volumens — wo sich der tatsächliche „faire Wert“-Magnet aktuell befindet, ohne die Sprunghaftigkeit einer rohen Point-of-Control-Berechnung.
  • Der weiße Trendfilter-EMA gibt Ihnen Kontext: Unterstützt die aktuelle Heat-Zone den vorherrschenden Trend oder widersetzt sie sich ihm?
  • Ein Live-HUD-Panel zeigt Ihnen den Trendzustand und genau, wie weit der Preis in Pips vom POC entfernt ist.

Wichtige Einstellungen: Länge des Rückblickfensters, Anzahl der Preisbereiche (Auflösung), POC-Glättung, EMA-Periode des Trendfilters und vollständige Farbgestaltung sowohl für die bullisch/bärische Mischung als auch für die POC-Linie.

Typische Anwendungsfälle: Erkennen, ob eine Unterstützungs-/Widerstandszone auf echtem Kauf- oder Verkaufsdruck basiert und nicht nur auf rohem Volumen; Verwendung des POC als dynamischen Fair-Value-Magneten; Bestätigung, ob das Volumen auf dem aktuellen Niveau mit dem vorherrschenden Trend übereinstimmt oder ihm widerspricht; Kombination mit dem eigenen Einstiegsmodell als Volumen-Kontextfilter.

Am besten geeignet für: Intraday-Trader bei Forex-Majors, Gold und Indizes, die mehr wollen als nur eine flache Volumenleiste oder eine einfarbige Heatmap — nützlich als eigenständige Analyse oder als Übereinstimmung neben struktur-basierten Setups.

Zusammenfassung

KI-Zusammenfassung
Impulse Heatmap is a directional volume heatmap indicator designed to analyze tick volume distribution across price zones with a focus on volume direction—buying versus selling—rather than just volume intensity. It segments volume into price bins similar to a volume profile but colors each bin based on the proportion of bullish-closing versus bearish-closing candle volume. Zones with predominantly bullish volume appear green, indicating accumulation or potential support, while zones with mostly bearish volume appear red, indicating distribution or potential resistance. Mixed zones show blended colors.

Key features include:
- Bright, saturated zones highlighting high volume concentration price levels.
- A gold Point of Control (POC) line representing a smoothed volume center of gravity as a dynamic fair value reference.
- A white trend filter EMA providing context on whether volume zones align with or oppose the prevailing trend.
- A live HUD panel displaying trend state and price distance from the POC in pips.
- Customizable settings for lookback window, price bin resolution, POC smoothing, trend filter EMA period, and color schemes.

Impulse Heatmap is suited for intraday traders focusing on forex majors, gold, and indices who require enhanced volume context to distinguish genuine buying or selling pressure at key support and resistance levels. It can be used standalone or combined with other structural or entry models.
Indikatorprofil
Indikatorkategorie
Trend
Ausgabetyp
Signale
Visualisierung
Datenanforderungen
Nur Balken
Tick-Daten
Unterstützte Signale
Ausbruch
Wendepunkt
Trendstärke
Volatilität
Eröffnungsspanne der Sitzung
Abweichung

Kundenbewertungen

0.0
Bewertungen: 0
Kundenbewertungen
Bisher gibt es keine Bewertungen für dieses Produkt. Haben Sie es schon ausprobiert? Dann können Sie die erste Person sein, die andere darüber informiert!

Diskussion

Häufig gestellte Fragen (FAQ)

EMA
Key Levels
AI-assisted
BOS
Volume
Market Structure
Support & Resistance
Über den cTrader Store verfügbare Produkte, einschließlich Handelsbots, Indikatoren und Plugins, werden von externen Entwicklern bereitgestellt und nur zu Informations- und technischen Zugriffszwecken verfügbar gemacht. cTrader Store ist kein Broker und erbringt keine Anlageberatung, persönlichen Empfehlungen oder eine Garantie für zukünftige Performance.

Mehr von diesem Autor

Indikator
AI-assisted
Order Block
+5
The daily bias estimator indicator uses ICT concepts to show whether the chart is bullish or bearish on multi-time frame
Indikator
ATR
BOS
+5
Full ICT/SMC 4-step setup checker that alerts a long or short setup.
Indikator
Volume
Fibonacci
+5
Classic 9:30 Opening Range Breakout — auto-plots the range, flags volume-confirmed breakouts long or short, live.
Indikator
Flag
VWAP
+5
Session VWAP with statistical deviation bands, gradient cloud, and live rejection alerts — see exactly how stretched pri
Indikator
MSS
AI-assisted
+5
Live ICT Silver Bullet detection: liquidity sweeps, structure shifts, and killzone-gated FVGs, graded and glowing in rea
Indikator
ATR
Key Levels
+5
CPR indicator that actually predicts the day ahead: width percentile scoring for breakout-day detection
Indikator
Triangle
Double Top
+5
Know which liquidity sweeps are real. Auto-tracks EQH/EQL and confirms genuine reversals, not just broken levels.
Indikator
ATR
MSS
+5
Grades ICT Unicorn setups (Breaker Block + FVG confluence) into PRIME / SETUP / WATCH, with retest & RR targets.
Indikator
BOS
Volume
+5
20/40/60-day IPDA lookback ranges, Premium/Discount/Equilibrium zones, and quarterly shift alerts — anchored to true dai
Indikator
BOS
MSS
+5
One indicator, full ICT/SMC picture — structure, OBs, FVGs, liquidity, Premium/Discount — with graded PRIME/SETUP signal
Indikator
ATR
Volume
+5
Order blocks with measured hold-rate stats and confidence scoring — not just zones on a chart.
Indikator
BOS
CHOCH
+5
BOS/CHoCH signals confirmed by liquidity sweep + FVG confluence, with a live conviction score.

Das könnte Sie auch noch interessieren

Indikator
ATR
SMC
+2
HTF POWER 3 ICT Power of 3 · M1 Precision · H4 Intelligence Auto-detect Accumulation → Manipulation → Distribution
„ATR Bands“-Logo
Beliebt
4.7
(4)
$19
Indikator
ATR
Prop
+13
Enhance trading with ATR Bands! Visualize market volatility using dynamic upper and lower ATR bands for precise decision
Indikator
RSI
Prop
+14
Unlock Stochastic RSI PRO in cTrader! Overlay RSI, highlight zones, and identify divergences with customizable settings.
Indikator
AI
ATR
+26
Entry Momentum MACD Power Guide
Indikator
AI
Prop
+14
Professional Trading Indicator Transform Your Trading with Intelligent Signal Detection RenkoProfit
Indikator
Prop
Forex
+5
Higher TimeFrame Candle Tracker: Current Timeframe (Any TimeFrame) Show High TimeFrame Candle Bar
Indikator
BOS
CHOCH
+5
BOS/CHoCH signals confirmed by liquidity sweep + FVG confluence, with a live conviction score.
Indikator
Volume
Order Block
+4
Volume Profile with fixed period, custom range and buy/sell pressure.
Indikator
Key Levels
Support & Resistance
Clean psychological round-number grid with native pip and point auto-scaling across Forex, Gold, Indices, and Crypto.
Indikator
BOS
MSS
+3
Orderblocks with Multi-Timeframe.
Indikator
This indicator is a valuable tool for traders looking to identify significant opening price level of any asset.
Indikator
AI
SMC
+5
Coloring trendline/ Colored Trendline / Color Trendline
„supertrend“-Logo
Beliebt
4.3
(3)
$20
Indikator
ATR
Prop
+4
Supertrend Indicator
Indikator
SMC
Prop
+11
Sessions PRO is a professional session visualization indicator - 4 Fully Customizable Sessions
Indikator
ATR
MSS
+5
Grades ICT Unicorn setups (Breaker Block + FVG confluence) into PRIME / SETUP / WATCH, with retest & RR targets.
Indikator
BOS
MSS
+5
Your entire ICT session map, structure engine, and key levels — No manual work. One indicator. Every session!
Indikator
Prop
Forex
+11
🌊 See when the market is truly in play. Tsunami measures Relative Volume by time-of-day 🌊
Indikator
Prop
Forex
+5
Pivot Point with base zone daily Asia-London-New york Session.

Preis

Seit 07/05/2026
5
Verkäufe
63
Kostenlose Installationen