

Beschreibung
Beherrschen Sie die Marktvolatilität ohne Chart-Chaos
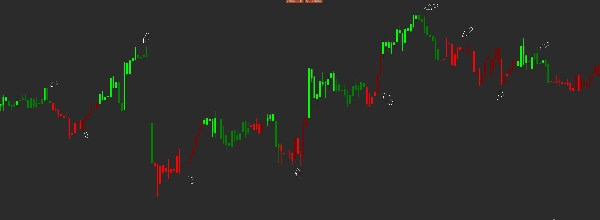
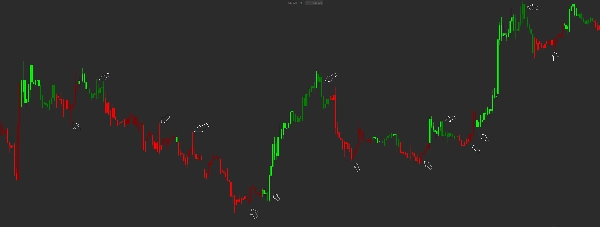
Der Squeeze Momentum Candle Painter ist ein ausgeklügelter Volatilitäts- und Momentum-Indikator, der auf der klassischen TTM Squeeze-Logik basiert. Anstatt Ihren Bildschirm mit Oszillatoren zu füllen, färbt dieses Tool Ihre Kerzenbalken intelligent ein, sodass Sie hochwahrscheinliche explosive Bewegungen und Trendwechsel erkennen können, während Ihr Hauptchart sauber und professionell bleibt.
Überblick
Der Markt wechselt zwischen zwei Zuständen: Kompression (Squeeze) und Expansion (Volatilität). Dieser Indikator nutzt die Beziehung zwischen Bollinger-Bändern und Keltner-Kanälen, um diese Phasen zu identifizieren, kombiniert mit einem linearen Regressions-Momentum-Algorithmus, um Trendrichtung und Stärke zu bestimmen.
Hauptmerkmale
-
- Intuitive Farbgebung: Erkennen Sie sofort das Trendmomentum durch 4 verschiedene Kerzenfarben.
- TTM Squeeze Algorithmus: Eingebaute Berechnung der Preiskompression und des Momentumgefälles.
- Sauberes UI-Design: Verzichtet auf ein separates Histogrammfenster und bietet mehr Platz für die Analyse der Kursbewegungen.
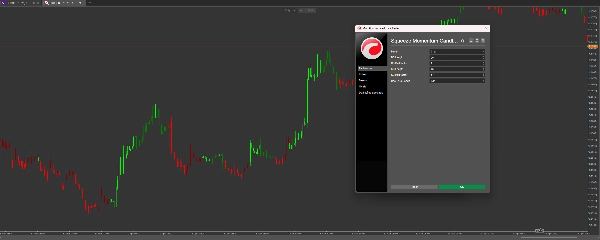
- Vollständig anpassbar: Passen Sie die Parameter der Bollinger-Bänder und Keltner-Kanäle an jeden Zeitrahmen oder jede Anlageklasse (Forex, Indizes oder Krypto) an.
- Zero-Lag-Logik: Verwendet lineare Regression, um Momentumverschiebungen schneller als traditionelle gleitende Durchschnitte zu erkennen.
Wie man die Farben liest :
-
- Limette » Starkes Aufwärtsmomentum (zunehmend)
- Grün » Abschwächendes Aufwärtsmomentum (verlangsamend)
- Rot » Starkes Abwärtsmomentum (zunehmend)
- Dunkelrot » Abschwächendes Abwärtsmomentum (verlangsamend)
Die Handelsstrategie
Der Aufbau: Wenn das Momentum gering ist (Dunkelrot oder Grün), befindet sich der Markt oft in einer "Squeeze"-Phase oder Konsolidierung.
Der Ausbruch: Achten Sie auf den Übergang von Grün zu Limette (bullisch) oder Dunkelrot zu Rot (bärisch). Dies zeigt an, dass das Momentum beschleunigt.
Der Ausstieg: Wenn eine Limettenkerze zu Grün wird oder eine Rotkerze zu Dunkelrot, signalisiert dies, dass die aktuelle Bewegung an Schwung verliert – ein perfekter Zeitpunkt, um Gewinne mitzunehmen oder Stop-Losses zu straffen.
Warum diesen Indikator wählen?
Die meisten Trader scheitern, weil sie zu spät reagieren. Der Squeeze Momentum Candle Painter visualisiert die "innere" Energie des Marktes. Indem Sie die Farbwechsel der Kerzen beobachten, gewinnen Sie einen psychologischen Vorteil, bleiben länger in Gewinntrades und steigen aus, bevor die Umkehr einsetzt.
Zusammenfassung
Key features include intuitive color coding of candles into four states—strong upward momentum (lime), weakening upward momentum (green), strong downward momentum (red), and weakening downward momentum (maroon)—which visually represent trend momentum without cluttering the chart with oscillators or histograms. The indicator’s parameters for Bollinger Bands and Keltner Channels are fully customizable to suit various timeframes and asset classes such as Forex, indices, and cryptocurrencies.
Traders can interpret the color transitions to identify consolidation phases, breakout points, and momentum weakening, aiding in entry and exit decisions. This tool integrates volatility regime, trend strength, and reversal signals into a clean, easy-to-read visualization directly on price bars.
Kundenbewertungen
5 | 100 % | |
4 | 0 % | |
3 | 0 % | |
2 | 0 % | |
1 | 0 % |



















![„[Hamster-Coder] Pivot Points MTF“-Logo](https://cdn.ctrader.com/image/webp/4c143e5a-309c-40e3-a578-f04d1e133ffa_31159)





