
Penerangan
MACD Custom MTF (Multiple Time Frame) v1.1 adalah alat canggih yang menggabungkan kekuatan terbukti MACD klasik dengan kelebihan kritikal analisis pelbagai jangka masa dan visualisasi moden yang intuitif. Direka untuk pedagang yang bijak yang menuntut ketepatan, tafsiran pantas, dan keupayaan untuk menyesuaikan alat mengikut strategi unik mereka.
Apa Yang Baru dalam Versi 1.1:
- Visual Lancar 100%: Memperbaiki garis MACD yang patah/tidak berterusan – garis kini sempurna berterusan semasa perubahan tren.
- Keterlihatan Lebih Baik: Meningkatkan saiz titik isyarat Beli/Jual, menebalkan Garis Isyarat dan Histogram untuk pandangan yang sangat jelas. Mengurangkan kecerahan Garis Sifar untuk mengurangkan ketegangan mata.
- Amaran Pintar & Dipermudahkan: Membersihkan tetingkap tetapan. Hanya togol "Amaran Beli" atau "Amaran Jual" dan penunjuk secara automatik mengendalikan Popup di skrin dan pemberitahuan bunyi yang betul.
- Tetapan Teratur: Semua parameter kini dikumpulkan dengan indah ke dalam kategori intuitif untuk pengalaman pengguna yang jauh lebih baik.
- Lokalisasi Bahasa Inggeris Penuh: Semua mesej log, popup, dan ralat telah dilokalkan sepenuhnya ke dalam Bahasa Inggeris.
Analisis Pelbagai Jangka Masa (MTF) pada Satu Carta:
Berhenti menukar carta! Paparkan data MACD dari jangka masa lebih tinggi (contohnya, H1, H4, D1) terus pada carta kerja semasa anda (contohnya, M5, M15). Dapatkan konteks pasaran yang lebih luas yang sangat berharga, kenal pasti tren utama yang mendasari, dan tapis dengan berkesan bunyi mengelirukan dari jangka masa lebih rendah. Boleh dikonfigurasi sepenuhnya – pilih dari senarai jangka masa yang komprehensif, dari minit hingga bulanan.
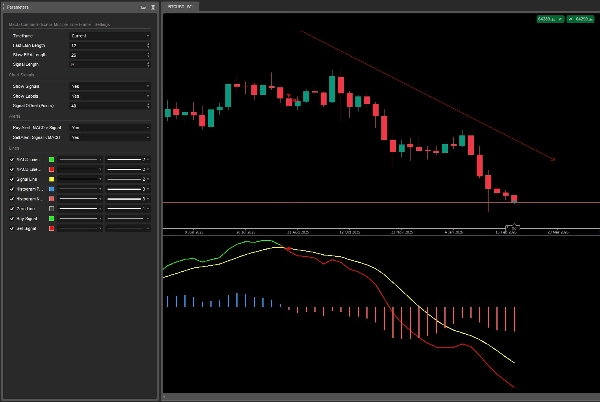
Pewarnaan Dinamik MACD & Garis Isyarat:
Pengesahan tren segera: Garis MACD berubah warna secara dinamik apabila melintasi garis isyaratnya, dengan jelas menggambarkan momentum bullish atau bearish. Tiada lagi tekaan – warna garis segera memberitahu anda jika MACD berada di atas (bullish) atau di bawah (bearish) isyaratnya.
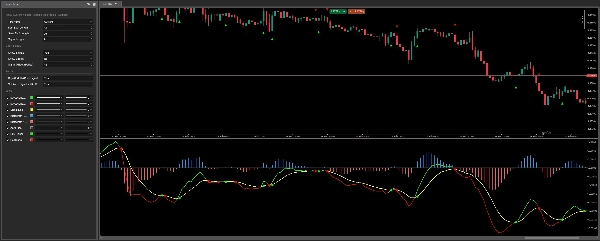
Histogram Jelas Kristal:
Visualisasikan dengan mudah perbezaan (kekuatan) antara MACD dan garis isyaratnya. Penunjuk secara intuitif mewarnakan bar yang dipertebal berdasarkan sama ada ia positif (biru) atau negatif (merah), memberikan pandangan mendalam tentang perubahan momentum dalam sekelip mata.
Isyarat Persilangan Visual yang Tidak Tertukar:
Jangan pernah terlepas persilangan kritikal lagi! Penunjuk secara automatik menyerlahkan persilangan garis MACD/Isyarat. Ia melukis titik yang berbeza dan sangat kelihatan terus pada carta harga anda (dengan offset yang boleh laras) dan menawarkan label teks "Beli"/"Jual" pilihan untuk kejelasan maksimum.
Amaran Pintar Terintegrasi:
Mempunyai pemberitahuan Popup dan Bunyi terbina dalam yang mudah untuk isyarat Beli dan Jual. Kekal maklum tentang setiap peluang tanpa perlu terpaku pada skrin anda! Hanya togol amaran dalam tetapan dan biarkan penunjuk memantau untuk anda.
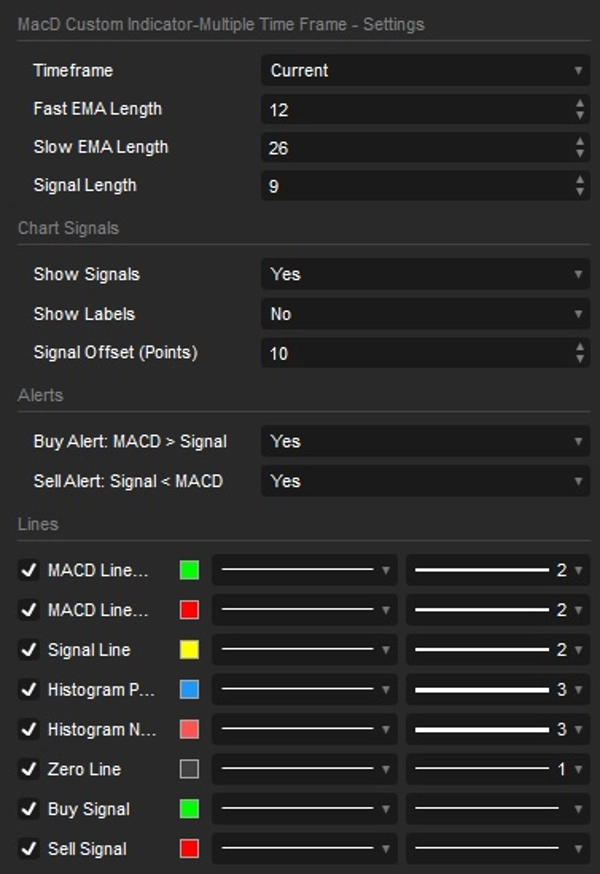
Penyesuaian Penuh di Hujung Jari Anda:
- Sesuaikan panjang EMA Pantas, EMA Perlahan, dan Garis Isyarat mengikut spesifikasi tepat anda.
- Semua tetapan disusun kemas ke dalam kumpulan logik (Tetapan MACD, Isyarat Carta, Amaran) untuk pelarasan pantas.
- Togol keterlihatan untuk elemen visual individu: Garis MACD & Isyarat, Histogram, Isyarat Persilangan, dan Label.
- Offset isyarat boleh laras untuk padanan sempurna dengan estetika dan keutamaan carta anda.
Ringkasan
Key features include dynamic coloring of the MACD and signal lines to indicate bullish or bearish momentum, a crystal-clear histogram that visualizes the divergence between MACD and its signal line with color-coded bars, and unmistakable visual crossover signals marked by distinct dots or arrows on the price chart. The indicator supports integrated alerts with popup and sound notifications for buy and sell signals, configurable via a streamlined settings interface.
Users can fully customize the indicator by adjusting Fast EMA, Slow EMA, and Signal Line lengths, toggling visibility of visual elements (lines, histogram, signals, labels), and modifying colors and line thickness. The settings are organized into intuitive categories for ease of use. This indicator supports a wide range of timeframes from minutes to monthly and is suitable for various markets including Forex, indices, commodities, stocks, and cryptocurrencies.
Ulasan pelanggan
5 | 100 % | |
4 | 0 % | |
3 | 0 % | |
2 | 0 % | |
1 | 0 % |


