Penerangan
This is not your typical Volume Delta Indicator. This is the Level 2 DOM Volume Delta Indicator — Institutional-Grade Order Flow for cTrader. The Edge Institutions Pay Millions For.
The Problem Every Retail Trader Faces. A candle closes green. Volume is high. You buy.
Price reverses instantly. You get stopped out. The chart "lied" to you.
It didn't lie — you just couldn't see what was happening inside the candle. That green bar with high volume? 70% of that volume was aggressive selling. The close was propped up by a thin layer of buy orders at the bottom of the range. Institutions were distributing into your buy order.
Standard volume indicators show you the total. They never show you who was in control.
Volume Delta changes that. What Volume Delta Actually Shows You
Volume Delta separates every bar's volume into buy volume and sell volume, then calculates the difference — the delta. A positive delta means buyers were more aggressive. A negative delta means sellers dominated.
This is the single most important piece of information that separates professional traders from retail traders: not how much was traded, but which side was trading more aggressively. That's conviction. The delta is the fingerprint of intent behind every price bar.
But it does not stop there
This indicator doesn't guess. In a proprietary mix of data it reads Level 2 Market Depth data — the actual order book sitting behind the price you see on screen.
Level 2 data (also known as DOM — Depth of Market) shows the real buy and sell orders stacked at every price level. Not the last trade. Not an estimate. The actual resting liquidity from banks, hedge funds, and institutional desks flowing through your broker's liquidity providers.
The result is an accuracy level of 85-95% in classifying buy versus sell volume — far beyond what any formula-based approximation can achieve.
Why This Matters — What Institutions See That You Don't
Goldman Sachs, Citadel, Jump Trading — they all trade with order flow data. They see the buy and sell pressure in real time. They see absorption. They see when a level is being defended. They see when the delta diverges from price.
They pay millions for this infrastructure. The data feeds, the co-located servers, the proprietary tools.
This indicator brings the same core concept to your cTrader chart. Not a watered-down version. The actual Level 2 DOM data from your broker's liquidity pool, processed into the same buy-versus-sell classification that professional order flow traders use.
The difference between a retail trader and an institutional trader isn't intelligence. It's information. Volume Delta closes that gap.
Who This Is For
Day traders who want to see through the noise. When a candle looks bullish but the delta is negative, you know to wait. When a candle looks weak but the delta is strongly positive, you know institutions are accumulating. The delta doesn't lie — it shows what happened, not what it looked like.
Scalpers who need to know which side is in control right now. A spike in delta on a breakout confirms it's real. A breakout with flat delta tells you it's a trap before the reversal even starts.
Swing traders who want confluence. Delta divergences — where price makes a new low but delta is rising — are among the most reliable reversal signals in professional trading. This indicator detects them automatically.
Anyone trading forex, indices, or commodities on cTrader with a broker that provides Level 2 data. Fusion Markets, IC Markets, Go Markets, and similar ECN/STP brokers all provide the DOM data this indicator reads.
If you've ever been on the wrong side of a "high volume" candle, this is the tool that tells you why.
What You Get
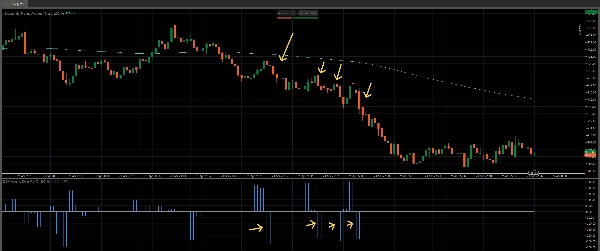
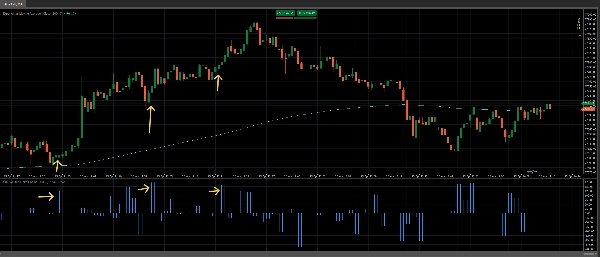
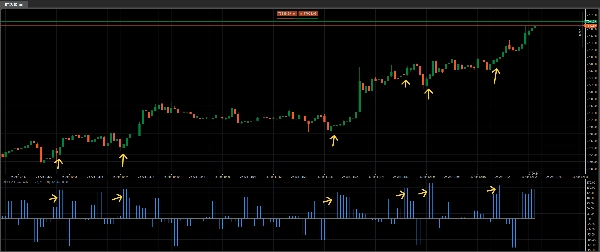
A clean, professional histogram below your chart showing the net delta for every bar, based on highly accurate data. Positive bars mean buyers dominated. Negative bars mean sellers dominated. The size of the bar shows you how much one side outweighed the other. Used together with indicators like the 200 ema gives confluence and high probability setups.
No clutter. No lagging moving averages of volume. No colored candles that "estimate" buying and selling. Just the raw, unfiltered difference between aggressive buying and aggressive selling — calculated from the deepest data source available to retail traders.
This indicator also provides the option to use a volume filter to only show bars that matter most. Aggregate volume bars if desired.
One look at the delta bar tells you what ten other indicators try to approximate. Get yours now for cTrader. This is a no-brainer for this low price.
Combine this with our Volume Profile Pro indicator for even better informed decisions at key levels: https://ctrader.com/products/4079
See our amazing Black Box Bot here: https://ctrader.com/products/3241
Ringkasan
The indicator displays a clean histogram below the chart representing net volume delta per bar: positive bars indicate buyer dominance, negative bars indicate seller dominance, and bar size reflects the strength of that dominance. This provides traders with insight into market intent beyond total volume, revealing whether buyers or sellers controlled the price action.
It supports forex, indices, and commodities trading with brokers offering Level 2 data, such as Fusion Markets and IC Markets. Features include volume filtering and aggregated volume bars. The tool is suited for day traders, scalpers, and swing traders seeking to interpret order flow, confirm breakouts, detect divergences, and enhance decision-making with professional-level order flow data.
Ulasan pelanggan
5 | 50 % | |
4 | 50 % | |
3 | 0 % | |
2 | 0 % | |
1 | 0 % |