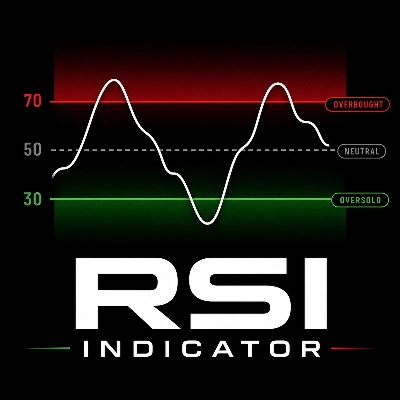
RSI Indicator
Indicateur
Version 1.0, May 2026
Windows, Mac
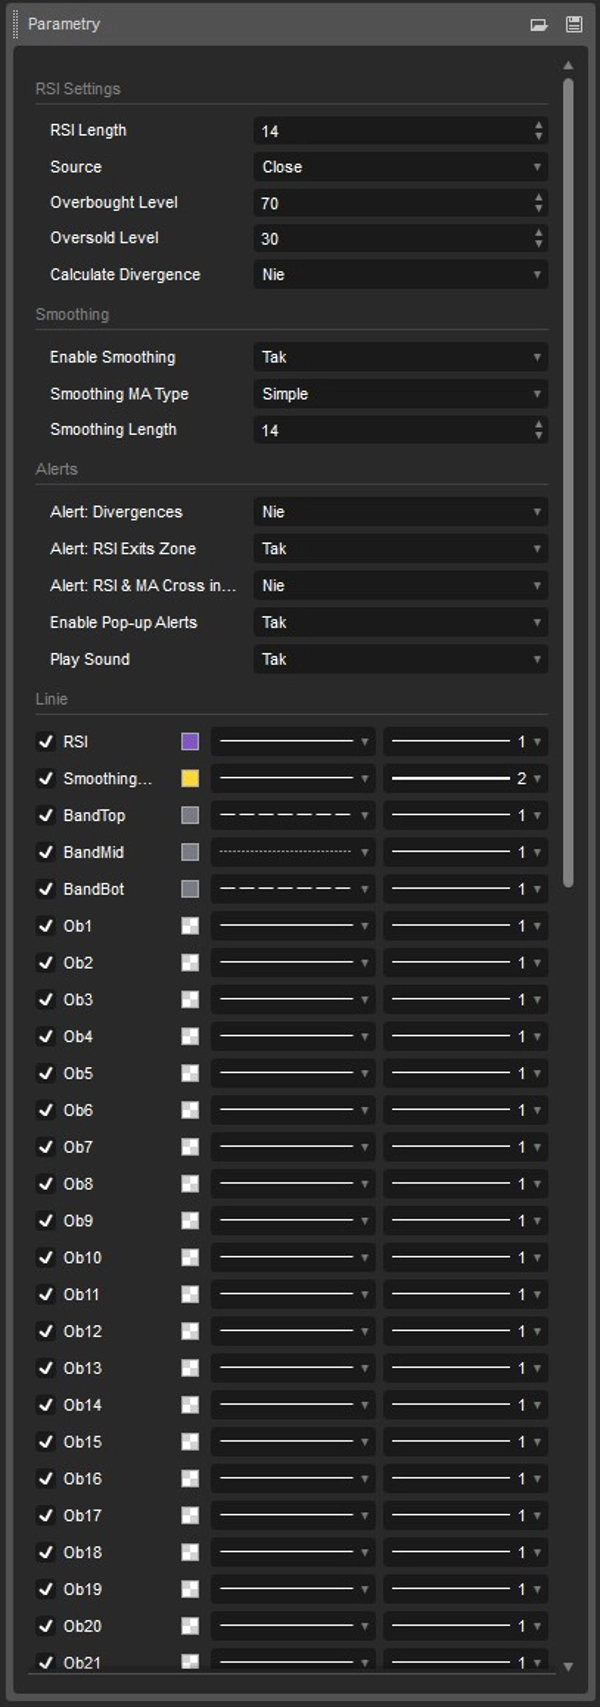
Trading product for RSI Indicator Indicateur SMA RSI, image 2
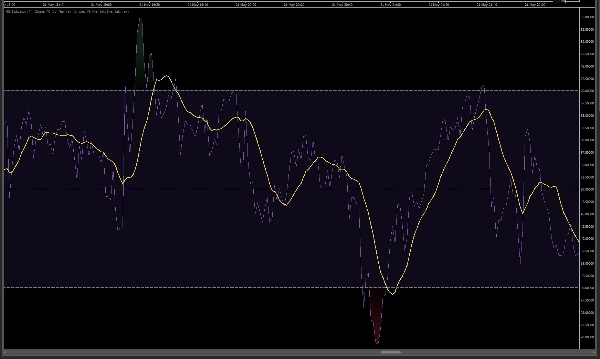
Trading product for RSI Indicator Indicateur SMA RSI, image 3
89
Ventes
150
Installations gratuites

Description

Vitrine :


Indicateur RSI - cet indicateur est une implémentation avancée mais épurée de l'oscillateur classique Relative Strength Index (RSI) pour la plateforme cTrader. Il a été développé en stricte conformité avec l'indicateur original de TradingView (basé sur leur spécification officielle).

Grâce à l'utilisation du modèle de lissage RMA (Running Moving Average), cet indicateur se comporte et s'affiche exactement comme son homologue TradingView. Nous avons également assuré une expérience visuelle parfaitement identique.

Principales caractéristiques et fonctions :

  • Compatibilité 100 % TradingView : L'algorithme utilise la même logique de calcul que l'indicateur TV original (basé sur la formule RMA).
  • Design visuel époustouflant (dégradés dynamiques) : Un système innovant d’ombrage de couleur à 30 niveaux est appliqué. Plus le RSI monte dans la zone de surachat (au-dessus de 70), plus le fond rouge devient intense. Plus il descend dans la zone de survente (en dessous de 30), plus le vert devient profond. La plage médiane conserve la teinte violette classique.
  • Moyenne mobile intégrée (MA) : Comme dans les dernières versions TV, vous pouvez activer une ligne de moyenne mobile (par exemple, SMA) qui lisse la ligne RSI et aide à identifier les tendances au sein même de l'oscillateur.
  • Détection automatique des divergences : L'indicateur peut scanner automatiquement le graphique à la recherche de divergences régulières. Lorsqu'il détecte un décalage entre le prix et la force de la tendance RSI, il trace des lignes et des marqueurs (Haussier : vert, Baissier : rouge) directement dans la fenêtre de l'indicateur.
  • Système d'alerte puissant (pop-up & son) : Restez informé en permanence. L'indicateur vous notifiera lorsque :
    • Le RSI sort des zones de surachat/survente (générant des signaux classiques d'achat/vente),
    • La ligne RSI croise la ligne MA profondément dans ces zones,
    • Une nouvelle divergence est détectée.

À qui s'adresse cet indicateur ?

Si vous avez l'habitude d'analyser le RSI sur TradingView, que vous recherchez des signaux parfaitement correspondants dans cTrader, et que vous appréciez un design épuré et visuellement attrayant (sans ajuster manuellement les couleurs), cet indicateur est une solution idéale.

Simple à utiliser, précis dans son fonctionnement, et fidèle à l'original !

cGuru

Résumé

Résumé IA
The RSI Indicator is a cTrader implementation of the classic Relative Strength Index oscillator, designed to replicate TradingView’s original indicator using the Running Moving Average (RMA) smoothing method. It provides 100% calculation compatibility with TradingView, ensuring identical signal behavior and visual presentation. Key features include a dynamic 30-level gradient color scheme that visually distinguishes overbought (red) and oversold (green) zones, with a neutral purple mid-range. The indicator supports an optional moving average line (e.g., SMA) to smooth the RSI curve and highlight trends within the oscillator. It also offers automatic detection of regular divergences between price and RSI trends, marking bullish and bearish divergences directly on the chart. A built-in alert system notifies users via pop-up and sound when the RSI exits overbought/oversold zones, crosses the moving average within these zones, or when new divergences are detected. This indicator is suitable for traders familiar with TradingView’s RSI who seek an accurate, visually clear, and feature-rich RSI tool within the cTrader platform.
Profil de l'indicateur
Catégorie de l'indicateur
Assistance et résistance
Type de résultat
Visualisation
Exigences en matière de données
Données de tick
Signaux pris en charge
Inversion
Divergence

Avis clients

0.0
Avis : 0
Avis clients
Il n'y a pas encore d'avis sur ce produit. Vous l'avez déjà essayé ? Soyez le premier à en parler aux autres !

Discussion

Questions fréquentes

SMA
RSI
Moving Average
Les produits disponibles sur cTrader Store, notamment les bots de trading, les indicateurs et les plug-ins, sont fournis par des développeurs tiers et mis à disposition à titre informatif et à des fins d'accès technique uniquement. cTrader Store n'est pas un courtier et ne fournit aucun conseil en investissement, aucune recommandation personnelle ni aucune garantie quant aux performances futures.

Plus de cet auteur

Indicateur
AI
ATR
+27
Trend Is Your Friend cBot - INDICATOR - Professional Grid, Pyramid, Swing & Scalp Trading Indicator
Indicateur
AI
ATR
+27
Supertrend Indicator
Indicateur
AI
ATR
+27
Nadaraya-Watson Envelope Indicator
Indicateur
AI
ATR
+27
Market Cipher B
Indicateur
AI
ATR
+27
Supertrend Indicator
Indicateur
AI
ATR
+26
MacD Custom Indicator-Multiple Time Frame
cBot
AI
ATR
+27
RSI Simple Grid cBot - grid trading strategy with RSI (Relative Strength Index) signals
26.8%
ROI
4.41
Facteur de profit
Indicateur
AI
ATR
+19
Market Cipher A
cBot
AI
ATR
+27
SmartHedge cBot - Your Trading Companion
1.26
Facteur de profit
cBot
ATR
RSI
+5
Trend is your friend cBot - Professional Grid, Pyramid, Swing & Scalp Trading System
28%
ROI
5.27
Facteur de profit
Indicateur
EMA
SMA
+3
MACD indicator modeled after TradingView, featuring a 4-color momentum histogram, sound/pop-up crossover alerts.

Vous pourriez aussi aimer

Indicateur
AI
ATR
+27
Smart Money Gaps: MTF FVG auto-detection, extension, and mitigation marker. Trade institutional imbalances.
Indicateur
BOS
MSS
+3
Orderblocks with Multi-Timeframe.
Indicateur
AI-assisted
Order Block
+5
The daily bias estimator indicator uses ICT concepts to show whether the chart is bullish or bearish on multi-time frame
Indicateur
ATR
RSI
+11
This indicator puts three helpful trading tools on your chart at once. Think of it like having three expert traders
Indicateur
AI
SMC
+17
Smart Support/Resistance lines auto calculated from D1/H4/H1/M15. Highly customizable visuals + built in Backtest Mode.
Indicateur
AI
SMC
+9
Identifies market trends (-10 to +10) using HMA with volume confirmation. Includes customizable alerts.
Indicateur
Drawdown Monitor
Proprietary trading desk risk monitoring dashboard!
Indicateur
ATR
Breakout
Detects swing highs/lows, structure, breakouts, trend lines, and fibs — great for price action trading.
Indicateur
AI
ATR
+27
Deep Mood Distribution (DMD) is a segmented volume-profile and sentiment tool that analyzes price action in fixed bar bl
Indicateur
Prop
Forex
+7
The Parabolic SAR, or "Stop and Reverse," is a dynamic technical analysis tool.
Indicateur
Forex
BTCUSD
+5
Buy-Side & Sell-Side Liquidity (BSL/SSL) Indicator
Indicateur
Forex
BTCUSD
+9
Market Sentiment Pro: Predict tops & bottoms using crowd psychology. Contrarian signals with 70-80% accuracy. Early Acce
Indicateur
Forex
Crypto
+3
MARainbow gives you the edge with four customizable moving averages—each color-coded for instant recognition.
Indicateur
Signal
Dark Poll Signal Indicator.liquidity leakage,precedes the great movement, accumulation, distribution
Indicateur
Prop
Forex
+9
Average Cost Price helps you keep track of your open positions on the chart. In doing so, it provides lines and explanat
Indicateur
ATR
RSI
+9
🚀 MACARX Indicator - The Multi-Indicator Trend Fusion 🚀
Indicateur
ATR
Prop
+15
Initial Range – Where the open writes the script.
Indicateur
EMA
SMA
+3
Pro MA Close Alert. Powerful indicator that instantly notifies you when price closes above or below your selected MA.

Prix

89
Ventes
150
Installations gratuites