

Penerangan
Pengagihan Mood Mendalam (DMD) 📊🧠
Gambaran Keseluruhan
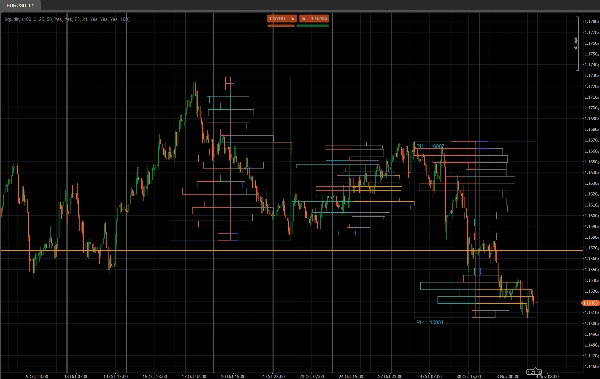
Pengagihan Mood Mendalam (DMD) adalah alat profil volum bersegmen dan sentimen yang menganalisis tindakan harga dalam blok bar tetap dan menunjukkan:
- Di mana aktiviti perdagangan tertumpu ⚖️
- Di mana kecairan adalah nipis atau reaktif (potensi zon S&D / kecairan) 💧
- Sisi mana yang menguasai di setiap kawasan harga (pembeli vs penjual) 🐂🐻
Daripada profil gelongsor tunggal, DMD membahagikan carta kepada blok berulang X bar dan membina peta kecairan & sentimen berasingan untuk setiap blok.
Ini memudahkan perbandingan visual bagaimana pengagihan volum dan mood pasaran berubah dari satu segmen ke segmen seterusnya.
Bagaimana ia berfungsi 🧩
Untuk setiap blok Bars In Profile lilin:
- Penunjuk mencari harga tertinggi dan terendah blok itu.
- Julat harga dibahagikan kepada
Number of Rowsbin harga menegak. - Untuk setiap lilin dalam blok:
-
- Isipadu tik adalah diagihkan ke setiap bin harga yang disentuh oleh julat lilin.
- Dua volum dikumpulkan untuk setiap baris:
-
- Jumlah volum pada baris harga itu
- Volum Bullish (hanya bar di mana Tutup > Buka)
- Daripada ini, DMD membina:
-
- Profil kecairan (bahagian kanan)
-
- Panjang baris ∝ volum relatif berbanding volum baris maksimum blok
- Warna menunjukkan nod dagangan tinggi / purata / rendah
- Profil sentimen (bahagian kiri)
-
- Sentimen setiap baris =
2 × BullishVolume − TotalVolume - Positif = didominasi pembeli (mood bullish)
- Negatif = didominasi penjual (mood bearish)
- Sentimen setiap baris =
- Proses diulang untuk N blok terakhir, supaya anda boleh membandingkan beberapa segmen secara berdampingan.
Bahagian Kanan – Profil Kecairan (Volum) 📊
Bar bahagian kanan menunjukkan berapa banyak aktiviti perdagangan (volum) berlaku pada setiap tahap harga dalam blok itu, tanpa mengira siapa yang membeli atau menjual.
- Nod volum tinggi (HVN) – contohnya bar oren
-
- Baris yang volumnya ≥
Peratus Ambang Dagangan Tinggidaripada volum baris maksimum dalam blok - Mewakili kawasan nilai, dagangan berat, zon konsolidasi.
- Baris yang volumnya ≥
- Nod volum rendah (LVN) – contohnya bar biru
-
- Baris yang volumnya ≤
Peratus Ambang Dagangan Rendahdaripada volum baris maksimum - Mewakili zon kecairan nipis, kemungkinan penolakan atau kawasan pergerakan pantas.
- Baris yang volumnya ≤
- Nod volum purata – contohnya bar kelabu
-
- Segala-galanya antara ambang tinggi dan rendah
- Tahap dagangan “normal”, tidak melampau.
🧠 Panjang bar (bahagian kanan)
→ Berkadar dengan jumlah volum dagangan pada baris harga itu berbanding volum maksimum blok.
Lebih banyak volum → bar lebih panjang.
Parameter utama:
Peratus Ambang Dagangan TinggiPeratus Ambang Dagangan Rendah
Bahagian Kiri – Profil Sentimen (Mood Pasaran) 🧠📉📈
Bar bahagian kiri menunjukkan sentimen / dominasi pada setiap tahap harga: sama ada pembeli atau penjual lebih kuat pada baris itu.
Untuk setiap baris:
Sentimen=2×BullishVolume−TotalVolume\text{Sentiment} = 2 \times \text{BullishVolume} - \text{TotalVolume}Sentiment=2×BullishVolume−TotalVolume
- Bar bullish (pembeli mengawal) – contohnya bar teal/hijau
-
- Sentimen > 0
- Lebih banyak volum datang dari lilin bullish (Tutup > Buka) pada harga itu.
- Menunjukkan dominasi sisi beli pada baris harga itu.
- Bar bearish (penjual mengawal) – contohnya bar merah
-
- Sentimen < 0
- Lebih banyak volum datang dari lilin bearish (Tutup < Buka).
- Menunjukkan dominasi sisi jual.
🧠 Panjang bar (bahagian kiri)
→ Berkadar dengan nilai mutlak sentimen (|Sentimen|) berbanding baris terkuat dalam blok.
Dominasi lebih kuat (ketidakseimbangan besar antara pembeli dan penjual) → bar lebih panjang.
Parameter utama:
Tunjukkan Profil Sentimen(hidup/mati)
Perincian Parameter ⚙️
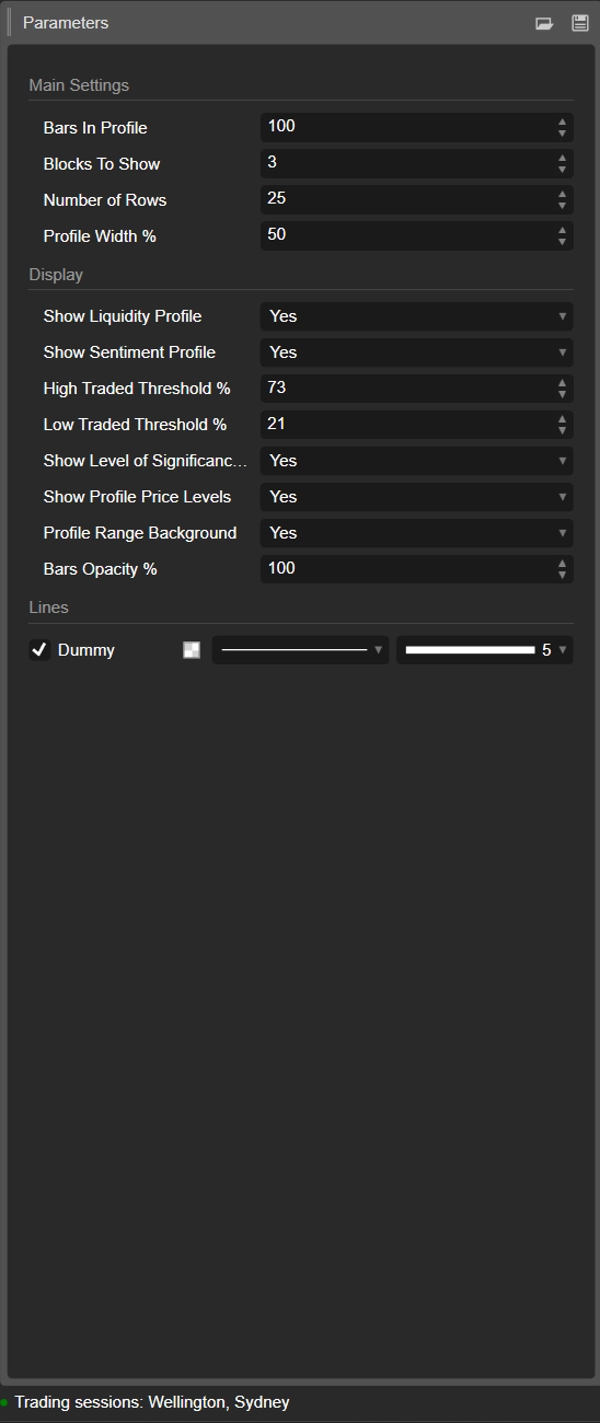
1. Bars In Profile
Kumpulan: Tetapan Utama
Bilangan lilin yang terkandung dalam setiap blok.
- Contoh:
Bars In Profile = 100 -
- Blok 0 → 100 bar terakhir
- Blok 1 → 100 bar sebelumnya
- Blok 2 → 100 sebelumnya, dan seterusnya.
Gunakan untuk memadankan blok kepada:
- anggaran sesi,
- jangka ayunan / intrahari tipikal anda,
- atau mana-mana tetingkap tersuai yang anda ingin analisis.
Nilai lebih kecil = lebih reaktif, lebih terperinci.
Nilai lebih besar = struktur lebih lancar, lebih “makro”.
2. Blocks To Show
Kumpulan: Tetapan Utama
Berapa banyak blok berturut-turut akan dilukis pada carta.
1→ hanya blok paling baru2–3→ sangat praktikal untuk perbandingan tanpa kekacauan- Nilai lebih tinggi → lebih banyak sejarah, tetapi lebih banyak objek pada carta
Blok lama melebihi nilai ini akan dibersihkan secara automatik untuk mengekalkan kestabilan.
3. Number of Rows
Kumpulan: Tetapan Utama
Resolusi menegak profil setiap blok.
Julat harga blok dibahagikan kepada sebanyak baris (tahap harga).
- Nilai lebih tinggi → lebih terperinci, baris lebih nipis, lebih banyak segi empat tepat
- Nilai lebih rendah → struktur lebih lancar, lebih mudah dibaca
Julat tipikal:
15–25untuk kegunaan intrahari biasa30–40+hanya jika anda mahukan resolusi sangat halus dan platform anda cukup kuat
4. Profile Width %
Kumpulan: Tetapan Utama
Mengawal sejauh mana profil meluas secara mendatar dari pusat blok, sebagai peratusan lebar blok.
- Mempengaruhi kedua-dua kecairan (bahagian kanan) dan sentimen (bahagian kiri).
- Peratusan lebih tinggi → profil meluas lebih jauh ke bar sekeliling
- Peratusan lebih rendah → profil padat dekat pusat blok
Nilai permulaan yang baik: 35–50%.
5. Show Liquidity Profile
Kumpulan: Paparan
Menghidupkan atau mematikan pengagihan volum (profil kecairan) (bahagian kanan setiap blok).
- Hidup ✅
-
- Panjang setiap baris mencerminkan volum dagangan relatif pada tahap harga itu.
- Warna menyandikan nod dagangan tinggi / purata / rendah.
- Mati ❌
-
- Hanya sentimen (jika diaktifkan) dipaparkan, tiada bar volum di kanan.
6. Show Sentiment Profile
Kumpulan: Paparan
Menghidupkan atau mematikan profil sentimen (bahagian kiri setiap blok).
- Hidup ✅
-
- Baris diwarnakan:
-
- Bullish (pembeli dominan) – contohnya aqua/hijau
- Bearish (penjual dominan) – contohnya merah
- Panjang baris mencerminkan kekuatan dominasi.
- Mati ❌
-
- Hanya pengagihan kecairan/volum tulen dipaparkan.
Gunakan ini jika anda mahu melihat bukan sahaja di mana volum didagangkan, tetapi siapa yang lebih aktif pada tahap tersebut.
7. High Traded Threshold %
Kumpulan: Paparan
Menentukan had untuk nod volum tinggi (HVN) dalam setiap blok.
- Dinyatakan sebagai % daripada volum baris maksimum blok.
- Contoh: Volum baris maksimum = 10,000; ambang = 70% → baris ≥ 7,000 dikira sebagai HVN.
HVN sering menandakan:
- kawasan nilai,
- zon konsolidasi,
- kawasan penempatan kuat / nilai adil.
8. Low Traded Threshold %
Kumpulan: Paparan
Menentukan had untuk nod volum rendah (LVN) berbanding volum maksimum blok.
- Baris dengan volum di bawah peratusan ini dianggap sebagai zon aktiviti rendah.
- Ini boleh bertindak sebagai:
-
- poket kecairan nipis,
- tahap penolakan berpotensi,
- atau kawasan di mana harga cenderung bergerak pantas.
Penggunaan tipikal: 15–30%.
9. Show Level of Significance (POC)
Kumpulan: Paparan
Menunjukkan atau menyembunyikan Titik Kawalan (POC) untuk blok paling baru.
- POC = baris harga dengan volum dagangan tertinggi dalam blok itu.
- Dipaparkan sebagai garis mendatar pada harga itu. 🎯
Berguna sebagai:
- rujukan untuk pembalikan purata,
- jangkar “harga adil” intrahari,
- atau tahap utama untuk pengurusan dagangan.
10. Show Profile Price Levels
Kumpulan: Paparan
Memaparkan label teks untuk:
- Profil Tinggi (PH) – harga tertinggi dicapai dalam blok
- Profil Rendah (PL) – harga terendah dicapai dalam blok
Label dipaparkan untuk blok paling baru dan termasuk nilai harga tepat.
Sesuai untuk:
- membaca julat semasa dengan cepat,
- menetapkan hentian/sasaran sekitar PH/PL,
- konteks untuk pecahan atau putaran.
11. Profile Range Background
Kumpulan: Paparan
Melukis segi empat tepat latar belakang separa telus yang meliputi:
- julat masa (bar mula hingga akhir)
- julat harga (rendah hingga tinggi)
Ini memisahkan blok secara visual dan menjadikan setiap julatan menonjol.
Matikan jika anda lebih suka visual yang lebih bersih dan minimal.
12. Bars Opacity %
Kumpulan: Paparan
Mengawal sejauh mana pekat atau halus segi empat tepat (kedua-dua bar kecairan dan sentimen).
- 20–40% → sangat ringan, gaya latar belakang
- 50–70% → keterlihatan seimbang, lilin masih mudah dilihat
- 80–100% → blok kuat, hampir tidak telus sepenuhnya
Secara dalaman nilai ini ditukar menjadi saluran alfa (0–255) untuk warna bar.
Templat permulaan yang dicadangkan ⭐
Untuk indeks / niaga hadapan intrahari (M5–M15):
- Bars In Profile: 80–120
- Blocks To Show: 2–3
- Number of Rows: ~20
- Profile Width %: 35–45
- Show Liquidity Profile: true
- Show Sentiment Profile: true
- Bars Opacity %: 50–65
Ringkasan
Key features include:
- Liquidity Profile (right side): Displays trading volume concentration at each price level within a block, highlighting high-volume nodes (HVNs), low-volume nodes (LVNs), and average-volume nodes. Bar length corresponds to relative traded volume, and colors indicate volume intensity.
- Sentiment Profile (left side): Shows buyer vs. seller dominance per price level, calculated as twice the bullish volume minus total volume. Positive values indicate buy-side control; negative values indicate sell-side control. Bar length reflects the strength of dominance, with color coding for bullish (green/teal) and bearish (red) sentiment.
- Configurable parameters: number of bars per profile block, number of blocks displayed, vertical resolution (rows), profile width, opacity, and thresholds for defining HVNs and LVNs.
- Additional display options: Point of Control (POC) line for highest volume price in the latest block, profile high/low price labels, and background shading for block ranges.
DMD supports analysis across various markets including indices, commodities, forex, and cryptocurrencies, facilitating identification of trading activity concentration, liquidity zones, and market sentiment shifts within customizable timeframes.
Ulasan pelanggan
5 | 0 % | |
4 | 100 % | |
3 | 0 % | |
2 | 0 % | |
1 | 0 % |


![Logo "Gaussian Channel [Iridio Capital]"](https://cdn.ctrader.com/image/webp/7c039209-5573-4a54-a072-f9528b503103_41960)


