
Penerangan
Pitch Pasaran (pendek)
Volume Delta & CVD — Baca aliran agresif secara masa nyata. Tetapan semula fleksibel (Hari/Minggu/Bulan), pilihan pelicinan EMA, dan delta kumulatif yang tidak melukis semula. Sesuai untuk mengesahkan pecahan dan mengesan perbezaan.
Volume Delta & CVD — Ulasan & Panduan Parameter
Slogan: Ukur ketidakseimbangan beli/jual (Delta) dan aliran kumulatifnya (CVD) dengan tetapan semula fleksibel. Tidak melukis semula.
Gambaran Keseluruhan
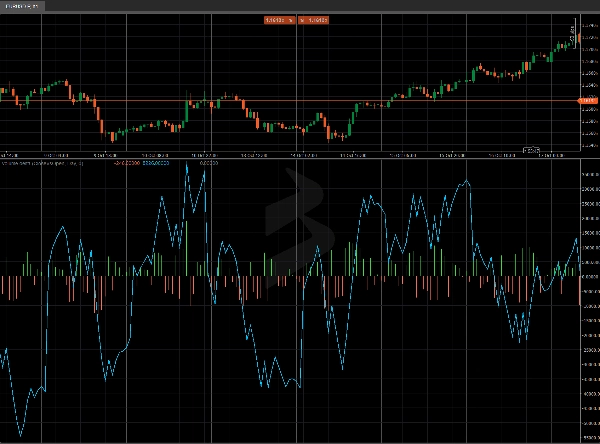
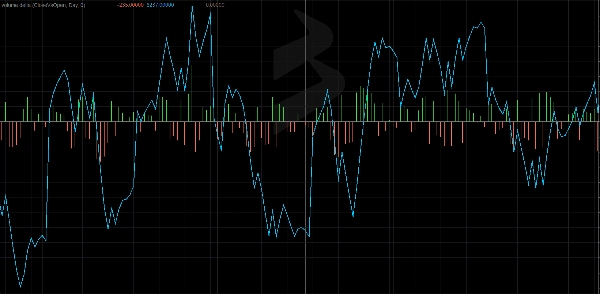
Volume Delta & CVD untuk cTrader mengira, setiap bar, Delta (pembelian agresif berbanding penjualan) dan CVD (Delta Isipadu Kumulatif). Ia membantu anda membaca tekanan aliran pesanan, mengesahkan pecahan, dan mengesan perbezaan terhadap harga.
Nota: Penunjuk menggunakan TickVolume (standard cTrader) sebagai proksi isipadu.
Parameter (terperinci)
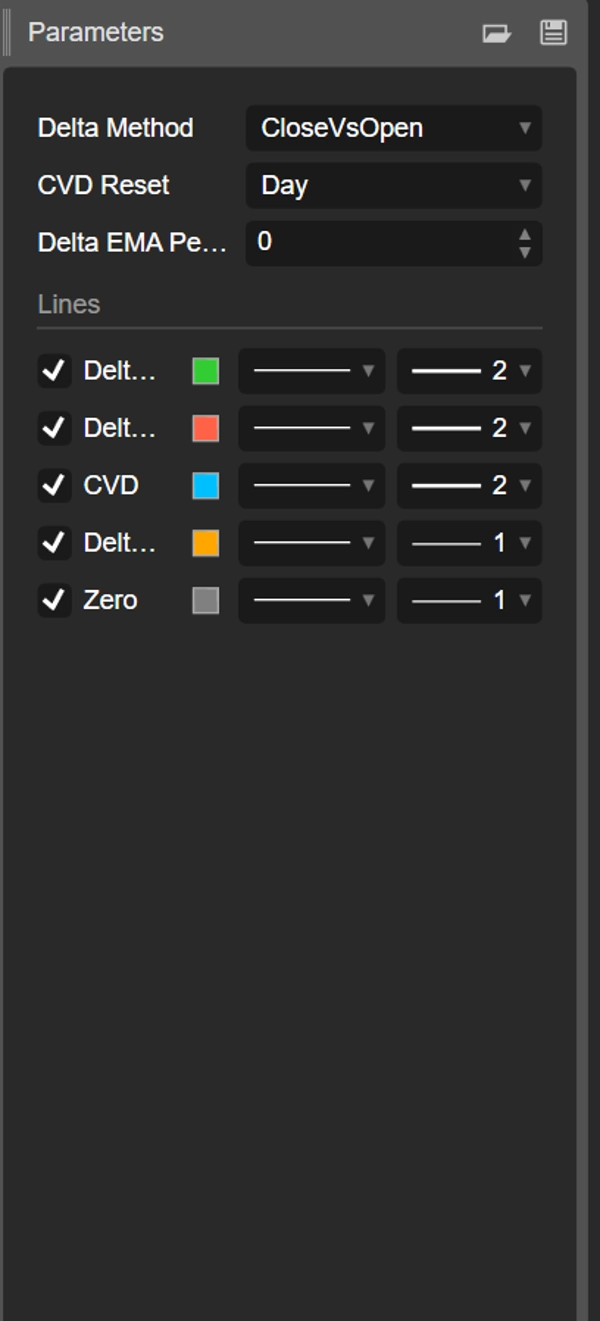
Kaedah Delta
Pilih bagaimana aliran arah bar dianggarkan:
- CloseVsPrevClose
Delta = ±TickVolume bergantung pada Close[t] vs Close[t-1].
Kelebihan: sangat responsif; sesuai untuk perubahan rejim intrahari. - CloseVsOpen
Delta = ±TickVolume bergantung pada Close vs Open bagi bar yang sama.
Kelebihan: menyerlahkan bar arah; mengurangkan bunyi silang bar. - Pengganda Aliran Wang (MFM)
MFM = ((Close−Low) − (High−Close)) / (High−Low)dalam [−1, +1]
Delta = MFM × TickVolume
Kelebihan: pemberat intra-bar; licin/kukuh apabila julat luas.
Tetapan Semula CVD
Mengawal bila kiraan kumulatif bermula semula:
- Tiada: berterusan dari permulaan carta.
- Hari: menetapkan semula pada setiap hari baru (bias intrahari).
- Minggu: menetapkan semula pada setiap minggu baru (ayunan).
- Bulan: menetapkan semula pada setiap bulan baru (bias jangka masa lebih tinggi).
Tempoh EMA Delta (0 = mati)
- Menerapkan EMA pada Delta untuk melicinkan histogram dan mendedahkan perubahan rejim.
- Cadangan: 5–9 scalping, 10–21 intrahari, 21–34 ayunan.
Output / Penimbal
- Delta Up (histogram hijau): bahagian Delta positif.
- Delta Down (histogram merah): bahagian Delta negatif.
- CVD (garis aqua): jumlah kumulatif Delta dengan tetapan semula yang dipilih.
- Delta EMA (garis oren, pilihan): Delta yang dilicinkan.
- Nol (garis kelabu): garis asas untuk perbandingan cepat.
Cara Membacanya
- Delta > 0 → dominasi pembelian agresif dalam bar.
- Delta < 0 → dominasi penjualan agresif dalam bar.
- CVD Meningkat → pengumpulan; CVD Menurun → pengedaran.
- Perbezaan
-
- Harga membuat tinggi lebih tinggi sementara CVD gagal mengesahkan → potensi keletihan tekanan beli.
- Harga membuat rendah lebih rendah sementara CVD gagal mengesahkan → potensi keletihan tekanan jual.
Buku Panduan Praktikal
- Pengesahan pecahan: utamakan pecahan panjang apabila CVD mempercepat dan Delta EMA bertukar positif.
- Memudar lanjutan: cari perbezaan harga vs CVD di tahap utama (VWAP/VWAP Berjangkar, S/R).
- Bias sesi: dengan Tetapan Semula CVD = Hari, baca arah dominan intrahari.
Mula Cepat
- Lampirkan penunjuk.
- Mulakan dengan Kaedah Delta = MFM, Tetapan Semula CVD = Hari, EMA = 10 (intrahari).
- Pada carta bising, tingkatkan EMA atau tukar ke CloseVsOpen.
- Cari kesesuaian dengan Anchored VWAP, S/R statik/dinamik, atau corak tindakan harga.
Prestasi & Keserasian
- API moden (
Bars.*,LineColor). - Pengiraan tidak melukis semula.
- Berfungsi pada mana-mana simbol dan jangka masa.
Ringkasan
The indicator supports three Delta calculation methods: CloseVsPrevClose (responsive for intraday shifts), CloseVsOpen (reduces noise by focusing on directional bars), and Money Flow Multiplier (MFM) which weights intra-bar volume for smoother results. An optional Exponential Moving Average (EMA) smoothing can be applied to Delta to highlight regime changes.
Outputs include separate histograms for positive and negative Delta, the CVD line, an optional Delta EMA line, and a zero baseline for reference. Traders can use the indicator to confirm breakouts, identify divergences between price and volume flow, and assess order-flow pressure. It works on any symbol and timeframe, supporting markets such as Forex, indices, commodities, stocks, and cryptocurrencies.


