
Breakout channel
Indikator
527 muat turun
Versi 1.0, Nov 2025
Windows, Mac
Penerangan
Saluran Pecah
Apa yang dilakukannya
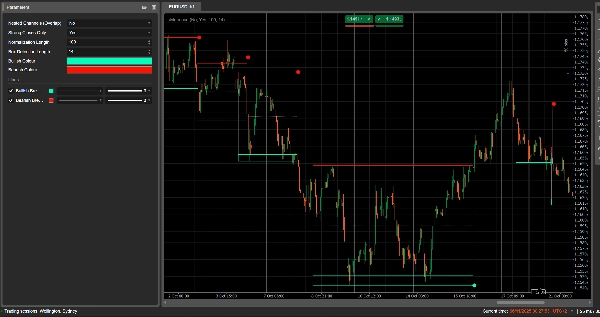
Saluran Pecah secara automatik mengesan julat pengukuhan (”kotak” harga) dan menandakan titik pecah apabila harga melepasi julat tersebut.
Ia melukis:
- Sebuah kotak saluran kelabu di sekitar zon pengukuhan
- Sebuah jalur atas merah (potensi rintangan)
- Sebuah jalur bawah hijau (potensi sokongan)
- Sebuah garis tengah putus-putus putih (tengah saluran)
- Titik berwarna apabila berlaku pecahan:
-
- Titik hijau/cyan di bawah kotak → pecahan menaik
- Titik merah di atas kotak → pecahan menurun
Idea ini adalah untuk menyerlahkan secara visual kawasan di mana harga berpilin dan di mana pergerakan kuat mungkin bermula apabila julat pecah.
Bagaimana ia mengira
- Penormalan harga
-
- Sepanjang Panjang Penormalan bar terakhir, ia mencari harga tertinggi dan harga terendah.
- Ia menormalisasikan penutupan ke dalam julat 0–1:
normalizedPrice=Close−LowestLowHighestHigh−LowestLow\text{normalizedPrice} = \frac{\text{Close} - \text{LowestLow}}{\text{HighestHigh} - \text{LowestLow}}normalizedPrice=HighestHigh−LowestLowClose−LowestLow
- Ukuran volatiliti
-
- Ia mengira sisihan piawai harga yang dinormalisasikan sepanjang 14 bar.
- Ini memberikan siri volatiliti yang digunakan untuk mengesan titik perubahan dalam struktur pasaran.
- Garis “volatiliti” Atas / Bawah
-
- Sepanjang (Panjang Pengesanan Kotak + 1) bar terakhir, ia mencari:
-
- bar di mana volatiliti adalah tertinggi
- bar di mana volatiliti adalah terendah
- Daripada berapa banyak bar yang lalu ekstrem ini berlaku, ia membina dua garis sintetik: Atas dan Bawah.
- Persilangan antara garis-garis ini menandakan permulaan/akhir potensi fasa saluran.
- Permulaan & tempoh saluran
-
- Apabila Bawah melintasi ke atas Atas, penunjuk menandakan permulaan saluran potensi.
- Daripada bar itu ia mengesan tempoh dan harga tertinggi / harga terendah dalam tempoh tersebut.
- Penciptaan saluran
-
- Apabila kemudian Atas melintasi kembali ke atas Bawah, dan tempoh lebih daripada 10 bar:
-
- Ia mentakrifkan Atas saluran sebagai harga tertinggi dalam tempoh itu.
- Ia mentakrifkan Bawah saluran sebagai harga terendah.
- Ia mengukur ATR/2 semasa untuk memisahkan zon nipis di atas dan bawah:
-
- Jalur merah di atas (jalur menurun)
- Jalur hijau di bawah (jalur menaik)
- Ia melukis:
-
- Segi empat tepat garis besar kelabu (saluran penuh)
- Garis besar atas merah
- Garis besar bawah hijau
- Sebuah garis tengah putus-putus putih melalui pusat
- Saluran kekal pada carta sebagai struktur sejarah (ia tidak dipadam selepas pecahan).
- Pengesanan pecahan
-
- Untuk setiap saluran aktif, pada setiap bar baru ia mengira harga rujukan:
-
- Jika Tutup Kuat Sahaja = benar → menggunakan tengah badan lilin:
refPrice=(Open+Close)/2\text{refPrice} = (\text{Open} + \text{Close})/2refPrice=(Open+Close)/2
Ini memerlukan lebih daripada separuh badan berada di luar kotak. - Jika Tutup Kuat Sahaja = palsu → menggunakan Tutup biasa.
- Jika Tutup Kuat Sahaja = benar → menggunakan tengah badan lilin:
- Peraturan pecahan:
-
- Jika
refPrice > Top→ pecahan menaik -
- Melukis titik hijau di Bawah saluran.
- Menonaktifkan saluran ini (menghentikan pemanjangan), tetapi kotak kekal kelihatan.
- Jika
refPrice < Bottom→ pecahan menurun -
- Melukis titik merah di Atas saluran.
- Menonaktifkan saluran.
- Jika tidak, saluran masih aktif dan tepi kanannya dilanjutkan ke bar semasa.
- Jika
- Pilihan Saluran Bersarang
-
- Jika Saluran Bersarang = benar, beberapa saluran boleh bertindih dari segi masa dan harga.
- Jika palsu, penunjuk menghalang penciptaan saluran baru yang akan bertindih dengan yang sedia ada.
Cara membaca dan menggunakannya
- Kotak kelabu (saluran)
-
- Mewakili zon pengukuhan / keseimbangan di mana harga telah diniagakan untuk beberapa ketika.
- Semakin panjang dan tinggi kotak, semakin penting julat tersebut.
- Jalur atas merah (zon rintangan)
-
- Bahagian atas saluran, ditekankan secara visual sebagai zon rintangan potensi.
- Penolakan berulang berhampiran jalur ini menunjukkan tekanan jualan dalam julat.
- Jalur bawah hijau (zon sokongan)
-
- Bahagian bawah saluran, diserlahkan sebagai sokongan potensi.
- Pantulan berulang menunjukkan pembeli mempertahankan tepi bawah julat.
- Garis tengah putus-putus putih
-
- Tengah saluran – sejenis “nilai adil” tempatan.
- Harga berayun di sekitar garis ini menunjukkan keseimbangan; pergerakan kuat menjauhi sering mendahului ujian jalur bertentangan.
- Titik pecah
-
- Titik hijau di bawah kotak:
-
- Harga telah ditutup dengan kuat di atas bahagian atas saluran (atau hanya ditutup di atas, bergantung pada Tutup Kuat Sahaja).
- Mencadangkan pecahan menaik – permulaan potensi pergerakan naik dari pengecutan volatiliti.
- Titik merah di atas kotak:
-
- Harga telah ditutup dengan kuat di bawah bahagian bawah saluran.
- Mencadangkan pecahan menurun – permulaan potensi pergerakan turun.
- Cara tipikal menggunakannya (pada tahap idea)
-
- Pecahan mengikuti tren
-
- Berniaga mengikut arah pecahan (beli selepas titik hijau, jual selepas titik merah), idealnya selari dengan tren jangka masa lebih tinggi atau penunjuk lain.
- Penapis & pengesahan
-
- Gunakan saluran dan pecahannya hanya sebagai penapis untuk strategi sedia ada anda (contohnya hanya ambil setup beli jika isyarat terakhir adalah pecahan menaik).
- Penempatan risiko
-
- Untuk pecahan menaik, ramai pedagang meletakkan stop di dalam atau sedikit di bawah saluran sebelumnya; untuk pecahan menurun, di dalam atau di atas kotak.
Ringkasan
Ringkasan AI
Breakout Channels is a technical indicator designed to identify consolidation zones and signal potential price breakouts. It automatically detects price ranges where the market is coiling, marking these with a grey channel box that highlights the consolidation area. The indicator draws a red upper band indicating potential resistance, a green lower band indicating potential support, and a white dotted midline representing the channel midpoint or local fair value.
Breakout points are signaled by colored dots: a green or cyan dot below the box indicates a bullish breakout, while a red dot above signals a bearish breakout. The indicator calculates these zones by normalizing price data, measuring volatility through the standard deviation of normalized prices, and identifying volatility extremes to define channel start and duration.
Channels remain visible on the chart as historical structures even after breakouts. Users can enable nested channels to allow overlapping consolidation zones. Breakout detection uses either candle body midpoints or close prices, depending on settings, to confirm strong closes outside the channel.
Typical uses include trading in the breakout direction, filtering existing strategies, and placing risk stops near channel boundaries. The indicator supports various markets including forex, indices, commodities, stocks, and cryptocurrencies.
Profil indikator
Ulasan pelanggan
0.0
Ulasan: 0
Ulasan pelanggan
Belum ada ulasan untuk produk ini. Anda sudah mencuba produk tersebut? Jadilah yang pertama untuk berkongsi pendapat anda!
Perbincangan
Soalan Lazim
Signal
Indices
Commodities
GBPUSD
RSI
Bollinger
Fibonacci
Scalping
AI
XAUUSD
NAS100
MACD
BTCUSD
Forex
Breakout
EURUSD
NZDUSD
Martingale
Prop
ZigZag
Supertrend
Fair Value Gap
SMC
Crypto
Grid
Stocks
ATR
USDJPY
VWAP
Produk yang tersedia melalui cTrader Store, termasuk bot dagangan, indikator dan plugin, disediakan oleh pembangun pihak ketiga dan diberikan akses untuk tujuan maklumat dan teknikal sahaja. cTrader Store bukan broker dan tidak memberikan nasihat pelaburan, syor peribadi atau sebarang jaminan prestasi masa hadapan.


![Logo "[Hamster-Coder] Bollinger Bands"](https://cdn.ctrader.com/image/webp/21d8e5d6-fb11-4bac-b9ee-cd05c2b76804_30327)


Harga
42.11M
Volum yang didagangkan
6.13M
Pip dimenangi
231
Jualan
8.56K
Pemasangan percuma