
VIX - volatility indicator
Indikator
2 pembelian
Versi 1.2, Apr 2026
Windows, Mac
4.5
Ulasan: 2
Penerangan
Penunjuk VIX proprietari ini, dikuasakan oleh Average True Range (ATR), memberikan analisis tepat dan bersih mengenai volatiliti pasaran, dioptimumkan untuk cTrader 5.5.13+. Ia menggabungkan pergerakan VIX yang diskala dengan analisis volum untuk mengesahkan peralihan utama dan potensi pecahan.
Ciri-ciri Utama & Kualiti Kod
- Tiada Pepijat/Amaran: Sepenuhnya diperbaharui kepada API cTrader terkini, menghapuskan semua ralat dan amaran lama untuk kestabilan dan prestasi maksimum.
- VIX Berasaskan ATR: Menyediakan ukuran responsif terhadap volatiliti, dinormalisasi untuk mengenal pasti keadaan pasaran yang melampau.
- Pengesahan Berganda: Menggunakan volatiliti (garis VIX) digabungkan dengan data Volum Tick untuk mengesahkan amaran pecahan berkemungkinan tinggi.
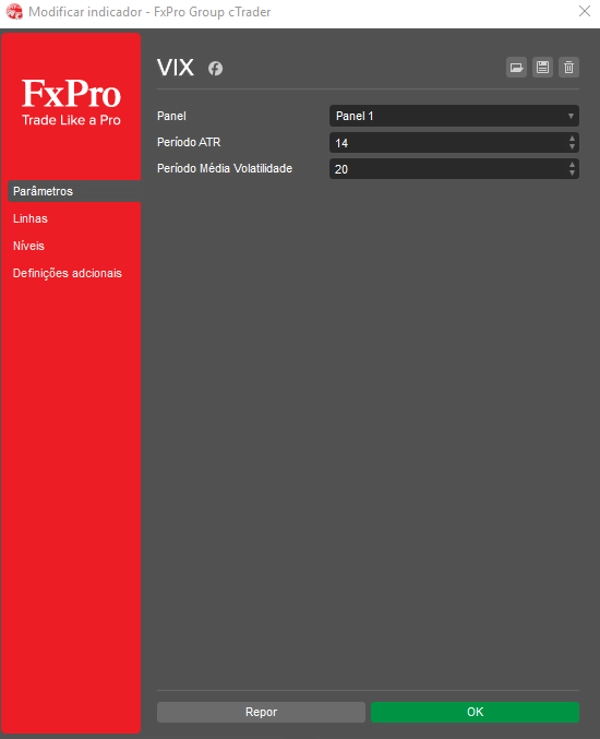
Sesuaikan Tetapan Anda untuk Wawasan Maksimum
Mudah laraskan penunjuk untuk padan dengan strategi dagangan anda dengan menetapkan nilai yang diingini untuk Tahap VIX Rendah dan Tahap VIX Tinggi. Selain itu, laraskan Faktor Skala VIX untuk mengawal dengan tepat ketinggian dan visualisasi garis VIX di panel bawah.
Cara Membaca Isyarat Pecahan & Konsolidasi
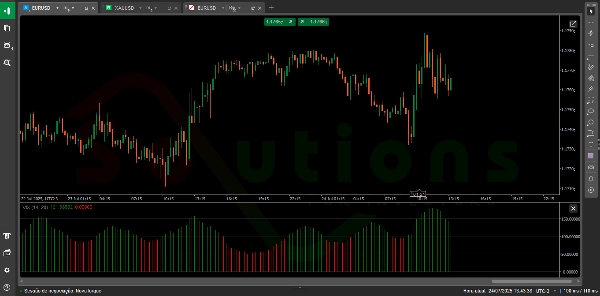
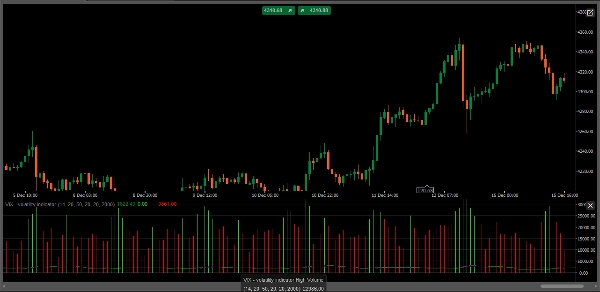
- Amaran Pecahan (Volatiliti Tinggi): Apabila garis VIX memecah dengan kuat di atas Tahap VIX Tinggi DAN disertai oleh volum tinggi (ditunjukkan oleh histogram Volum Tinggi), ini mengesahkan ketakutan/ketamakan melampau dan menandakan pecahan pasaran berkemungkinan tinggi.
- Isyarat Konsolidasi (Volatiliti Rendah): Apabila garis VIX jatuh di bawah Tahap VIX Rendah, ia sering menunjukkan tempoh ketenangan pasaran, konsolidasi ketat, atau potensi pembalikan purata — sesuai untuk menyediakan langkah seterusnya atau mengurangkan risiko.
- Wawasan Volum: Penunjuk memplot histogram Volum Tinggi (Hijau) dan Volum Rendah (Merah) di latar belakang, membolehkan anda menilai dengan segera kecairan dan keyakinan di sebalik tindakan harga semasa.
Ringkasan
Ringkasan AI
The VIX - Volatility Indicator is a proprietary tool designed for the cTrader platform (version 5.5.13 and above) that measures market volatility using an Average True Range (ATR)-based approach. It combines a scaled VIX line with tick volume data to provide dual confirmation of market conditions, helping traders identify potential breakouts and consolidation phases.
Key features include:
- ATR-based VIX calculation for responsive volatility measurement normalized to detect extreme market conditions.
- Volume analysis with high (green) and low (red) volume histograms to assess liquidity and conviction behind price movements.
- Customizable parameters allowing users to set Low VIX Level and High VIX Level thresholds, as well as adjust the VIX Scale Factor for optimal visualization.
Usage signals:
- A breakout alert occurs when the VIX line surpasses the High VIX Level accompanied by high volume, indicating potential market breakouts driven by extreme fear or greed.
- A consolidation signal is identified when the VIX falls below the Low VIX Level, suggesting periods of low volatility, market calm, or potential mean reversion.
This indicator supports analysis across various markets including Forex, indices, commodities, stocks, and cryptocurrencies.
Profil indikator
Ulasan pelanggan
4.5
Ulasan: 2
5 | 50 % | |
4 | 50 % | |
3 | 0 % | |
2 | 0 % | |
1 | 0 % |
Ulasan pelanggan
March 6, 2025
ngl, breaks are easier to judge and that is enough to keep testing it. It is not the whole trading plan.
February 28, 2025
reads better when the chart already supports the idea. Spread and slippage need a line in the notes.
Perbincangan
Soalan Lazim
BTCUSD
Forex
Signal
Breakout
Indices
EURUSD
Commodities
GBPUSD
NZDUSD
Prop
Crypto
Stocks
XAUUSD
NAS100
USDJPY
Produk yang tersedia melalui cTrader Store, termasuk bot dagangan, indikator dan plugin, disediakan oleh pembangun pihak ketiga dan diberikan akses untuk tujuan maklumat dan teknikal sahaja. cTrader Store bukan broker dan tidak memberikan nasihat pelaburan, syor peribadi atau sebarang jaminan prestasi masa hadapan.


![Logo "[Hamster-Coder] Pivot Points MTF"](https://cdn.ctrader.com/image/webp/4c143e5a-309c-40e3-a578-f04d1e133ffa_31159)


Harga
Sejak 05/02/2025
31
Jualan