
Penerangan
Bias Struktur Heikin Ashi (Penunjuk cTrader)
Zon bekalan–permintaan automatik dengan bias pelbagai jangka masa.
Apa yang ia lakukan – dalam Bahasa Inggeris mudah
Penunjuk ini secara automatik:
- Membaca tindakan harga Heikin Ashi dan mengesan peralihan pivot yang bermakna.
- Membina zon sokongan dan rintangan dinamik di sekitar pivot tersebut, menggunakan kedua-dua ekstrem wick dan badan lilin (bukan hanya garis rawak).
- Menggabungkan zon berdekatan dengan bijak supaya anda melihat tahap yang bersih dan boleh diniagakan dan bukannya hutan garis mendatar.
- Menjana bias bullish atau bearish yang jelas setiap kali harga benar-benar memecah zon sokongan atau rintangan terkini.
- Menunjukkan anda bias untuk:
-
- Jangka masa graf anda, dan
- Jangka masa lebih tinggi pilihan (lalai H2) — tanpa melukis kekacauan HTF pada graf anda.
Hasil: satu pandangan memberitahu anda di mana tahap sebenar berada dan sama ada pasaran kini condong ke atas atau ke bawah.
Masalah yang diselesaikannya
Kebanyakan pedagang menghadapi isu yang sama:
- Garis sokongan/rintangan yang dilukis secara manual adalah:
-
- subjektif,
- tidak konsisten,
- dan sering berlebihan.
- Penunjuk “zigzag + garis mendatar” mudah:
-
- tidak mengendalikan lebar zon dengan betul,
- menumpuk tahap di atas satu sama lain,
- atau melanjutkan zon sehingga menutupi separuh graf.
- Bias sering “dalam kepala anda” – bukan sesuatu yang anda boleh lihat dengan jelas atau gunakan secara berasaskan peraturan.
Penunjuk ini dibina untuk:
- Menukar struktur Heikin Ashi menjadi zon yang jelas dan objektif,
- Memberi anda trend/bias berasaskan peraturan berdasarkan zon tersebut,
- Sambil memastikan graf bersih dan mudah dibaca.
Bagaimana zon dibina (penjelasan mesra pedagang)
Untuk setiap pivot Heikin Ashi, penunjuk melihat pada struktur 3 lilin:
- Apabila HA bertukar dari merah ke hijau, ia menandakan pivot sokongan.
- Apabila HA bertukar dari hijau ke merah, ia menandakan pivot rintangan.
Kemudian ia membina zon:
Zon sokongan
- Mencari wick terendah di antara 3 lilin (ekstrem sebenar).
- Mencari rendah seterusnya yang masih lebih tinggi daripada ekstrem itu.
- Menggunakan badan lilin (buka/tutup) berhampiran rendah dalaman itu untuk mentakrifkan sisi “boleh diniagakan” zon tersebut.
- Zon sokongan akhir:
-
- Bawah = wick rendah ekstrem,
- Atas = tahap dalaman berdasarkan badan.
Zon rintangan
- Mencari wick tertinggi di antara 3 lilin.
- Mencari tinggi seterusnya yang masih lebih rendah daripada ekstrem itu.
- Menggunakan badan berhampiran tinggi dalaman itu.
- Zon rintangan akhir:
-
- Atas = wick tinggi ekstrem,
- Bawah = tahap dalaman berdasarkan badan.
Jadi setiap zon bukan sekadar jalur sewenang-wenangnya:
Ia adalah julatan wick-ke-badan yang mewakili di mana harga benar-benar ditolak atau berbalik.
Logik penggabungan (mengapa graf kekal bersih)
Zon jenis yang sama (sokongan dengan sokongan, rintangan dengan rintangan):
- Dilangsungkan sebagai unit pada garis masa.
- Boleh bergabung hanya jika mereka benar-benar bertindih dalam harga.
- Penggabungan adalah secara tempatan:
-
- Zon baru boleh bergabung dengan:
-
- zon paling terkini (bersebelahan), atau
- zon kedua paling terkini (+1 jarak), dan
- Satu penggabungan “jangkar” tambahan di belakang itu jika zon gabungan baru kini bertindih dengan struktur sebelumnya.
Ini menjadikan tingkah laku intuitif:
- Zon tidak “menelan” keseluruhan sejarah.
- Tahap lama dihormati tetapi tidak dibenarkan mencipta mega-zon gergasi.
- Struktur tempatan seperti A–B–C atau A–C+D dikendalikan dengan cara terkawal.
Logik bias (bagaimana anda sebenarnya berdagang dengannya)
Untuk setiap jangka masa (utama dan HTF):
- Penunjuk menjejaki zon sokongan gabungan terkini dan zon rintangan gabungan terkini.
- Kemudian, pada setiap lilin yang ditutup:
-
- Jika harga tutup di atas zon rintangan terkini → bias menjadi Bullish.
- Jika harga tutup di bawah zon sokongan terkini → bias menjadi Bearish.
Ia menyimpan:
- Masa flip bias terakhir,
- Tahap harga di mana harga memecah zon tersebut.
Pada graf, panel teks kecil menunjukkan:
Main (H1) Bias: BullishMain (H1) Shift: 11/26 15:00 @1.08750
Jika HTF diaktifkan, anda juga akan melihat sesuatu seperti:
HTF (H2) Bias: BearishHTF (H2) Shift: 11/25 08:00 @1.09200
Anda juga boleh mengaktifkan amaran bunyi apabila bias jangka masa utama bertukar.
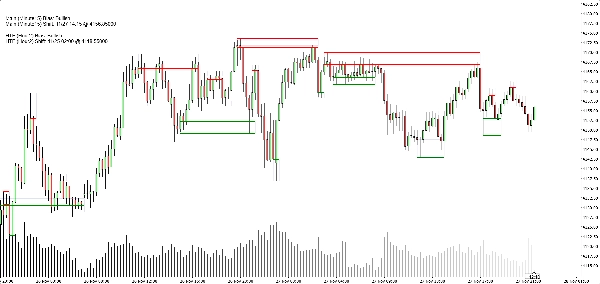
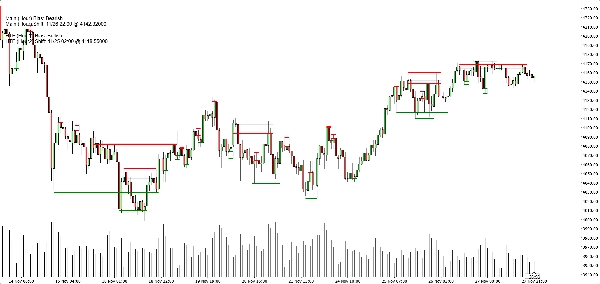
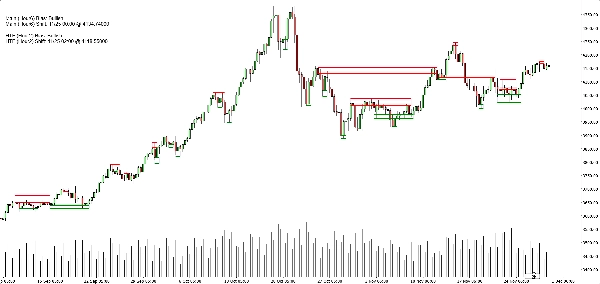
Apa yang anda lihat pada graf
- Zon sokongan:
-
- Garis asas/trigger mendatar hijau (pilihan),
- Sebuah segi empat lembut navy (kelegapan sangat rendah) menunjukkan jalur sokongan penuh.
- Zon rintangan:
-
- Garis merah + segi empat lembut navy untuk jalur tersebut.
- Togol paparan bersih:
-
- Tunjuk/sembunyi zon sokongan,
- Tunjuk/sembunyi zon rintangan,
- Hidupkan/matikan segi empat yang diisi,
- Hidupkan/matikan garis asas/trigger,
- Hidupkan/matikan panel bias.
Ini membolehkan pedagang yang berbeza memilih antara:
- Penampilan yang lebih minimalis (mungkin hanya segi empat), atau
- Pandangan yang lebih tepat (garis tepat kelihatan).
Kes penggunaan tipikal
Anda boleh meletakkannya sebagai berguna untuk:
- Penapisan trend
-
- Hanya cari beli apabila kedua-dua bias TF utama dan HTF adalah Bullish.
- Hanya cari jual apabila kedua-duanya Bearish.
- Kemasukan zon
-
- Gunakan zon sebagai kawasan minat untuk:
-
- Pesanan had,
- Kemasukan pengesahan (contoh: harga kembali ke zon yang pecah dan tolak semula),
- Penempatan henti tepat di luar jalur luar.
- Analisis dari atas ke bawah
-
- Bias HTF (H2 secara lalai) sebagai gambaran besar,
- Bias TF graf untuk penentuan masa,
- Zon untuk tahap pelaksanaan konkrit.
Apa yang ia BUKAN (penting untuk penjualan jujur)
- Ia bukan robot yang berdagang automatik untuk anda.
- Ia bukan isyarat “grail suci” yang menjamin keuntungan.
- Ia adalah enjin struktur dan bias:
-
- Mentakrifkan zon secara objektif,
- Mentakrifkan trend/bias secara objektif berdasarkan zon tersebut,
- Meninggalkan pengurusan dagangan sebenar kepada pedagang/strategi.
Ringkasan
It provides a rule-based bullish or bearish bias by tracking price breaks above resistance or below support zones on both the current chart timeframe and an optional higher timeframe. This bias is displayed on a built-in dashboard panel, with optional sound alerts for bias changes.
The indicator works across all timeframes and markets where price forms swings, including forex, crypto, stocks, and futures. It features customizable lookback periods, automatic cleanup of old zones, and toggles for display elements to suit different trader preferences.
Typical uses include trend filtering by aligning biases across timeframes, identifying zone entries for limit or confirmation orders, and supporting top-down analysis. The tool timestamps and sequences pivots and bias shifts, facilitating automation or journaling. It is a structure and bias engine that aids traders in objectively defining market levels and trends while maintaining chart clarity.
Ulasan pelanggan
5 | 33 % | |
4 | 67 % | |
3 | 0 % | |
2 | 0 % | |
1 | 0 % |


![Logo "High-Low Divergence [Iridio Capital]"](https://cdn.ctrader.com/image/webp/443c4661-7abb-40f1-842f-4b6ec560649b_40914)


