
Penerangan
ANALISIS TREND adalah penunjuk teknikal lanjutan untuk platform cTrader yang menggabungkan pelbagai pendekatan analisis ke dalam satu penyelesaian. Dibangunkan untuk pedagang yang mencari pengesahan trend melalui konvergensi penunjuk, ia menawarkan pandangan pasaran yang lengkap dengan isyarat tepat dan penapis pengesahan.
TONTON VIDEO PENGENALAN TENTANG STRATEGI OPERASI!
🎯 STRATEGI PENGGUNAAN
1. Perdagangan Mengikuti Trend
Aplikasi: Kenal pasti dan ikuti trend yang telah ditetapkan
Tempoh Masa: H4, D1 untuk posisi yang lebih panjang
Tetapan: ADX > 25, Volum di atas purata
Pengurusan Risiko: Hentikan kerugian di bawah purata bergerak 50-tempoh
2. Perdagangan Swing
Aplikasi: Tangkap pergerakan jangka sederhana
Tempoh Masa: H1, H4
Tetapan: Penapis volum diaktifkan, pengesahan oleh Profil Volum
Sasaran: Profil Volum POC sebagai TP
3. Perdagangan Breakout
Aplikasi: Masuk pada pecahan sokongan/rintangan
Tetapan: Volum PVA untuk mengesahkan kekuatan pergerakan
Pengesahan: ADX meningkat + Volum di atas purata
4. Scalping (Tempoh Masa Lebih Pendek)
Aplikasi: Perdagangan cepat dengan pelbagai pengesahan
Tempoh Masa: M1, M5
Tetapan: Penapis volum ketat dan Momentum
🔧 BAGAIMANA PENUNJUK BERFUNGSI
INTI ADX & DI
ADX (Indeks Arah Purata)
Fungsi: Ukur kekuatan trend
Tafsiran:
0-25: Trend lemah/pergerakan mendatar
25-50: Trend kuat
50+: Trend sangat kuat
Penggunaan Praktikal: Elakkan perdagangan apabila ADX < 20
+DI / -DI (Penunjuk Arah)
+DI: Kekuatan pembeli
-DI: Kekuatan penjual
Isyarat: Persilangan +DI melebihi -DI (beli) dan sebaliknya
Cerun ADX (Cerun ADX)
Fungsi: Ukur pecutan trend
Plotting: Histogram cyan
Isyarat: Nilai positif menunjukkan trend yang menguat
PENAPIS VOLUM
Penapis MA Volum
Fungsi: Sahkan isyarat dengan volum di atas purata
Parameter: Tempoh 20, Pengganda 1.0
Penggunaan: Pengesahan minat institusi
Volum PVA (Analisis Harga Volum)
Warna dan Maksud:
Hijau: Beli dengan volum sangat tinggi (>150% purata)
Biru: Beli dengan volum tinggi
Merah: Jual dengan volum sangat tinggi
Merah Jambu: Jual dengan volum tinggi
Kuning: Bar Pin/Kepenatan dengan pecahan sokongan
PROFIL VOLUM
POC (Titik Kawalan)
Fungsi: Harga dengan volum dagangan tertinggi
Penggunaan: Sasaran semula jadi untuk perdagangan, sokongan/rintangan dinamik
Kawasan Nilai
Fungsi: Zon di mana 70% volum telah didagangkan
Tafsiran:
Harga di atas: Trend menaik
Harga di bawah: Trend menurun
Di dalam: Pergerakan mendatar mungkin
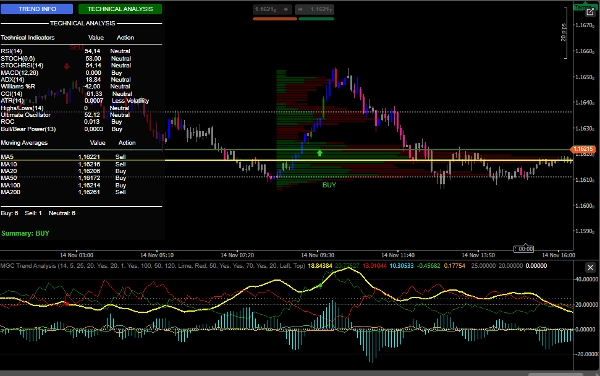
ANALISIS TEKNIKAL LENGKAP
Panel Penunjuk
RSI: Jualan berlebihan (<30) / Pembelian berlebihan (>70)
MACD: Momentum
Williams %R: Keadaan Ekstrem
CCI: Pengenalpastian Pembalikan
Stochastic: Momentum jangka pendek
Ultimate Oscillator: Momentum pelbagai tempoh masa
Purata Bergerak
Set lengkap MA (5, 10, 20, 50, 100, 200)
Analisis penjajaran untuk trend
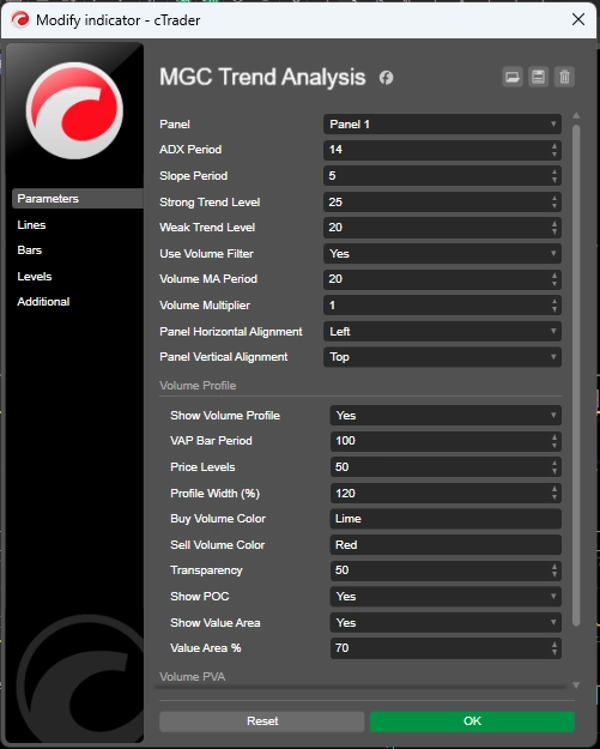
⚙️ TETAPAN YANG DISYORKAN
Tetapan Konservatif
javascript
Tempoh ADX: 14
Tempoh Cerun: 5
Tahap Trend Kuat: 25
Tahap Trend Lemah: 20
Gunakan Penapis Volum: true
Tempoh MA Volum: 20
Pengganda Volum: 1.2
Tetapan Agresif
javascript
Tempoh ADX: 10
Tempoh Cerun: 3
Tahap Trend Kuat: 20
Tahap Trend Lemah: 15
Gunakan Penapis Volum: true
Tempoh MA Volum: 14
Pengganda Volum: 1.0
Profil Volum (Disyorkan)
javascript
Tunjukkan Profil Volum: true
Tempoh Bar VAP: 100
Tahap Harga: 50
Peratus Kawasan Nilai: 70
Tunjukkan POC: true
🎨 SUMBER VISUAL
Antara Muka Pengguna
Panel Dinamik: Maklumat masa nyata
Butang Interaktif: Tukar antara analisis
Warna Intuitif: Pengekodan berasaskan fungsi
Isyarat Grafik
Anak Panah: Masuk BELI/JUAL
Bunyi: Amaran boleh didengar
Warna Bar: Analisis PVA terintegrasi
Ringkasan
Key components include the Average Directional Index (ADX) and Directional Indicators (+DI, -DI) to measure trend strength and direction, with ADX slope indicating trend acceleration. Volume filters such as Volume Moving Average and Price Volume Analysis (PVA) validate signals by confirming institutional interest and trade strength. The Volume Profile feature highlights the Point of Control (POC) and Value Area, aiding in identifying dynamic support/resistance and trend conditions.
Additional technical tools integrated in the indicator panel include RSI, MACD, Williams %R, CCI, Stochastic, Ultimate Oscillator, and multiple moving averages (5 to 200 periods) for momentum, reversal, and trend alignment analysis. The user interface offers a dynamic panel with real-time data, interactive controls, color-coded signals, graphical BUY/SELL arrows, audible alerts, and bar coloring based on PVA analysis.
Recommended settings are provided for both conservative and aggressive trading styles, with adjustable ADX periods, slope periods, volume filters, and volume profile parameters.
Ulasan pelanggan
5 | 67 % | |
4 | 33 % | |
3 | 0 % | |
2 | 0 % | |
1 | 0 % |


